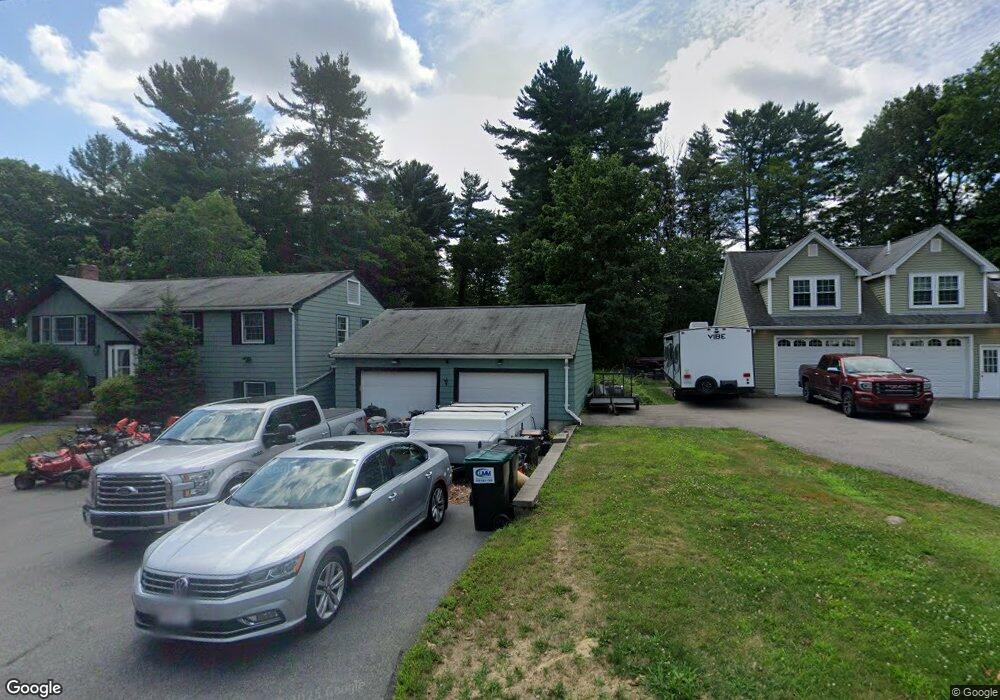
41 Walnut St Foxboro, MA 02035
Estimated Value: $633,000 - $677,000
3
Beds
3
Baths
1,008
Sq Ft
$653/Sq Ft
Est. Value
About This Home
This home is located at 41 Walnut St, Foxboro, MA 02035 and is currently estimated at $658,679, approximately $653 per square foot. 41 Walnut St is a home located in Norfolk County with nearby schools including Foxborough High School, Foxborough Regional Charter School, and Hands-On-Montessori School.
Ownership History
Date
Name
Owned For
Owner Type
Purchase Details
Closed on
Dec 4, 2003
Sold by
Ellsworth James R
Bought by
Johnson Scott E
Current Estimated Value
Home Financials for this Owner
Home Financials are based on the most recent Mortgage that was taken out on this home.
Original Mortgage
$270,000
Outstanding Balance
$124,440
Interest Rate
6.03%
Mortgage Type
Purchase Money Mortgage
Estimated Equity
$534,239
Create a Home Valuation Report for This Property
The Home Valuation Report is an in-depth analysis detailing your home's value as well as a comparison with similar homes in the area
Home Values in the Area
Average Home Value in this Area
Purchase History
| Date | Buyer | Sale Price | Title Company |
|---|---|---|---|
| Johnson Scott E | $342,500 | -- |
Source: Public Records
Mortgage History
| Date | Status | Borrower | Loan Amount |
|---|---|---|---|
| Open | Johnson Scott E | $270,000 |
Source: Public Records
Tax History Compared to Growth
Tax History
| Year | Tax Paid | Tax Assessment Tax Assessment Total Assessment is a certain percentage of the fair market value that is determined by local assessors to be the total taxable value of land and additions on the property. | Land | Improvement |
|---|---|---|---|---|
| 2025 | $6,561 | $496,300 | $223,300 | $273,000 |
| 2024 | $6,034 | $446,600 | $223,300 | $223,300 |
| 2023 | $6,166 | $433,900 | $212,600 | $221,300 |
| 2022 | $6,039 | $415,900 | $203,300 | $212,600 |
| 2021 | $5,489 | $372,400 | $184,800 | $187,600 |
| 2020 | $5,149 | $353,400 | $184,800 | $168,600 |
| 2019 | $5,024 | $341,800 | $176,000 | $165,800 |
| 2018 | $4,901 | $336,400 | $176,000 | $160,400 |
| 2017 | $4,783 | $318,000 | $164,500 | $153,500 |
| 2016 | $4,778 | $322,400 | $158,400 | $164,000 |
| 2015 | $4,565 | $300,500 | $133,700 | $166,800 |
| 2014 | $4,466 | $297,900 | $131,100 | $166,800 |
Source: Public Records
Map
Nearby Homes
- 12 Spring St
- 356 Central St
- 11 W Belcher Rd Unit 2
- 80 Mill St
- 18 Winter St Unit E
- 84 Cocasset St Unit A6
- 14 Winter St Unit B
- 24 Mechanic St
- 14 Baker St
- 11 Orchard Place Unit 11
- 406 South St
- 450 West St
- 166 Chauncy St
- 619 N Main St
- 28 Angell St
- 42 Angell St
- 44 Angell St Unit 44
- 22 Pleasant St Unit C
- 14 Foxhill Rd
- 82 Brook St