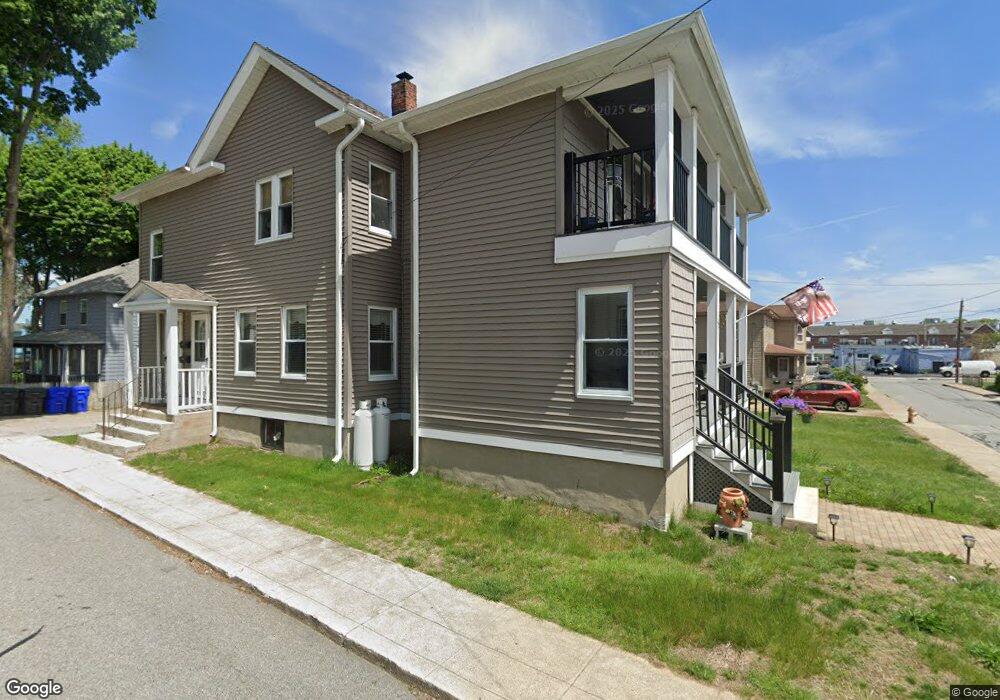
41 Weaver St West Warwick, RI 02893
West Warwick Centre NeighborhoodEstimated Value: $503,001 - $561,000
6
Beds
2
Baths
2,500
Sq Ft
$215/Sq Ft
Est. Value
About This Home
This home is located at 41 Weaver St, West Warwick, RI 02893 and is currently estimated at $537,250, approximately $214 per square foot. 41 Weaver St is a home located in Kent County with nearby schools including West Warwick High School, Islamic School of Rhode Island, and St Joseph School.
Ownership History
Date
Name
Owned For
Owner Type
Purchase Details
Closed on
Jul 28, 2017
Sold by
Hanouille Sarah I
Bought by
Hanouille Sarah I and Hanouile Michael A
Current Estimated Value
Home Financials for this Owner
Home Financials are based on the most recent Mortgage that was taken out on this home.
Original Mortgage
$78,900
Outstanding Balance
$42,124
Interest Rate
3.91%
Mortgage Type
New Conventional
Estimated Equity
$495,126
Create a Home Valuation Report for This Property
The Home Valuation Report is an in-depth analysis detailing your home's value as well as a comparison with similar homes in the area
Home Values in the Area
Average Home Value in this Area
Purchase History
| Date | Buyer | Sale Price | Title Company |
|---|---|---|---|
| Hanouille Sarah I | -- | -- |
Source: Public Records
Mortgage History
| Date | Status | Borrower | Loan Amount |
|---|---|---|---|
| Open | Hanouille Sarah I | $78,900 | |
| Previous Owner | Hanouille Sarah I | $40,000 | |
| Previous Owner | Hanouille Sarah I | $32,270 |
Source: Public Records
Tax History Compared to Growth
Tax History
| Year | Tax Paid | Tax Assessment Tax Assessment Total Assessment is a certain percentage of the fair market value that is determined by local assessors to be the total taxable value of land and additions on the property. | Land | Improvement |
|---|---|---|---|---|
| 2025 | $6,875 | $481,100 | $83,900 | $397,200 |
| 2024 | $6,117 | $327,300 | $53,300 | $274,000 |
| 2023 | $5,996 | $327,300 | $53,300 | $274,000 |
| 2022 | $5,904 | $327,300 | $53,300 | $274,000 |
| 2021 | $4,773 | $207,500 | $43,700 | $163,800 |
| 2020 | $4,752 | $206,600 | $43,700 | $162,900 |
| 2019 | $6,058 | $206,600 | $43,700 | $162,900 |
| 2018 | $4,409 | $162,200 | $41,100 | $121,100 |
| 2017 | $4,267 | $162,200 | $41,100 | $121,100 |
| 2016 | $4,191 | $162,200 | $41,100 | $121,100 |
| 2015 | $4,024 | $155,000 | $41,100 | $113,900 |
| 2014 | $899 | $155,000 | $41,100 | $113,900 |
Source: Public Records
Map
Nearby Homes
- 29 Weaver St
- 11 Tuckerman St
- 45 Weaver St
- 42 Weaver St
- 8 Tuckerman St
- 32 Weaver St
- 40 Weaver St
- 23 Weaver St
- 43 Archambault Ave
- 28 Weaver St
- 48 Weaver St
- 35 Archambault Ave Unit 37
- 29 Archambault Ave
- 26 Weaver St
- 53 Weaver St
- 50 Weaver St
- 55 Archambault Ave
- 32 Gardner Ave
- 36 Gardner Ave
- 30 Gardner Ave