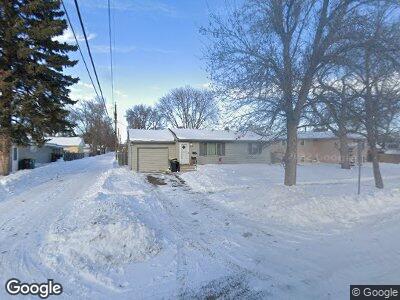
410 4th Ave W West Fargo, ND 58078
Francis NeighborhoodEstimated Value: $235,413 - $247,000
2
Beds
1
Bath
814
Sq Ft
$296/Sq Ft
Est. Value
About This Home
This home is located at 410 4th Ave W, West Fargo, ND 58078 and is currently estimated at $241,207, approximately $296 per square foot. 410 4th Ave W is a home located in Cass County with nearby schools including Westside Elementary School, Cheney Middle School, and West Fargo High School.
Ownership History
Date
Name
Owned For
Owner Type
Purchase Details
Closed on
Apr 17, 2018
Sold by
Heise Travis J and Heise Nika M
Bought by
Heise Travis J and Heise Nika M
Current Estimated Value
Home Financials for this Owner
Home Financials are based on the most recent Mortgage that was taken out on this home.
Original Mortgage
$100,000
Outstanding Balance
$84,823
Interest Rate
3%
Mortgage Type
Adjustable Rate Mortgage/ARM
Estimated Equity
$136,942
Purchase Details
Closed on
Mar 15, 2012
Sold by
Mcdonald Debora and Estate Of Lilice Holmen
Bought by
Heise Travis J
Home Financials for this Owner
Home Financials are based on the most recent Mortgage that was taken out on this home.
Original Mortgage
$98,439
Interest Rate
2.55%
Mortgage Type
FHA
Purchase Details
Closed on
Jul 26, 2005
Sold by
Holmen Edwin and Holmen Lilice
Bought by
Holmen Edwin and Holmen Lilice
Create a Home Valuation Report for This Property
The Home Valuation Report is an in-depth analysis detailing your home's value as well as a comparison with similar homes in the area
Home Values in the Area
Average Home Value in this Area
Purchase History
| Date | Buyer | Sale Price | Title Company |
|---|---|---|---|
| Heise Travis J | -- | Title Co | |
| Heise Travis J | $101,000 | None Available | |
| Holmen Edwin | -- | -- |
Source: Public Records
Mortgage History
| Date | Status | Borrower | Loan Amount |
|---|---|---|---|
| Open | Heise Travis J | $32,134 | |
| Open | Heise Travis J | $100,000 | |
| Closed | Heise Travis J | $98,439 |
Source: Public Records
Tax History Compared to Growth
Tax History
| Year | Tax Paid | Tax Assessment Tax Assessment Total Assessment is a certain percentage of the fair market value that is determined by local assessors to be the total taxable value of land and additions on the property. | Land | Improvement |
|---|---|---|---|---|
| 2024 | $2,125 | $96,050 | $17,500 | $78,550 |
| 2023 | $2,590 | $94,250 | $17,500 | $76,750 |
| 2022 | $2,493 | $86,550 | $17,500 | $69,050 |
| 2021 | $2,303 | $77,000 | $12,750 | $64,250 |
| 2020 | $2,245 | $77,150 | $12,750 | $64,400 |
| 2019 | $2,196 | $75,400 | $12,750 | $62,650 |
| 2018 | $2,086 | $74,700 | $12,750 | $61,950 |
| 2017 | $1,972 | $72,300 | $12,750 | $59,550 |
| 2016 | $1,760 | $70,600 | $12,750 | $57,850 |
| 2015 | $1,602 | $58,700 | $8,500 | $50,200 |
| 2014 | $1,549 | $54,100 | $8,500 | $45,600 |
| 2013 | $1,574 | $54,100 | $8,500 | $45,600 |
Source: Public Records
Map
Nearby Homes
- 410 4th Ave W
- 402 4th Ave W
- 416 4th Ave W
- 314 Morrison St
- 317 Francis St
- 422 4th Ave W
- 313 Francis St
- 308 Morrison St
- 401 Francis St
- 307 Francis St
- 408 Morrison St
- 317 Morrison St
- 302 Morrison St
- 407 Francis St
- 313 Morrison St
- 401 Morrison St
- 301 Francis St
- 307 Morrison St
- 414 Morrison St
- 405 Morrison St