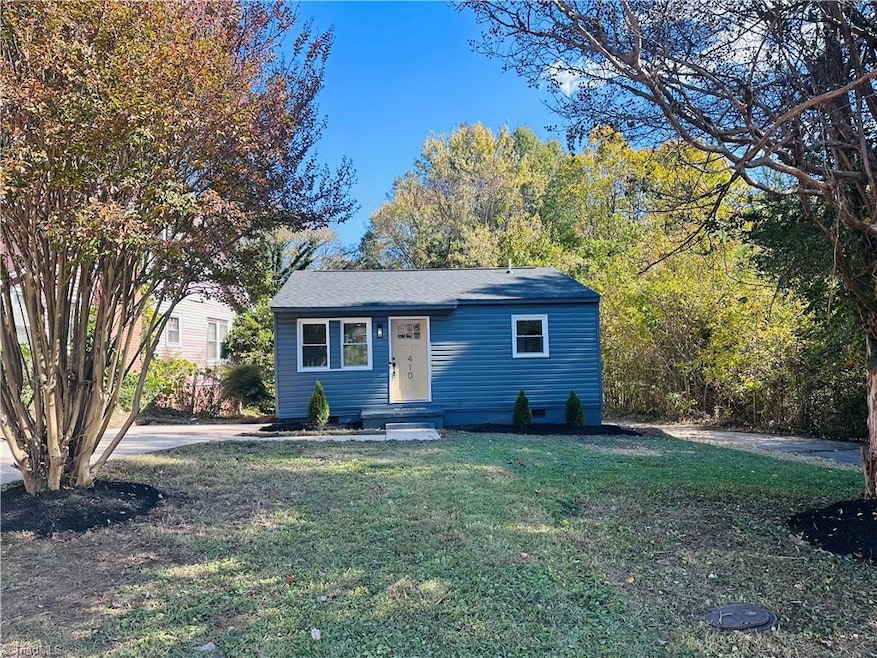

410 4th St High Point, NC 27260
Downtown High Point NeighborhoodEstimated payment $985/month
About This Home
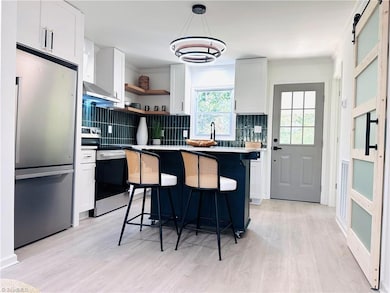
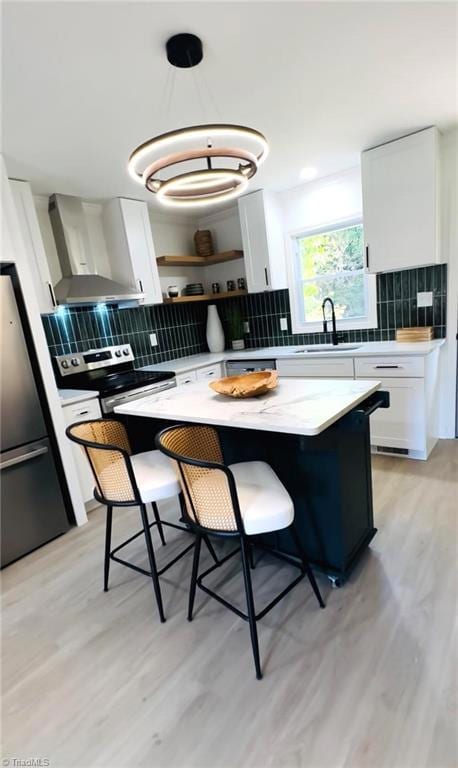
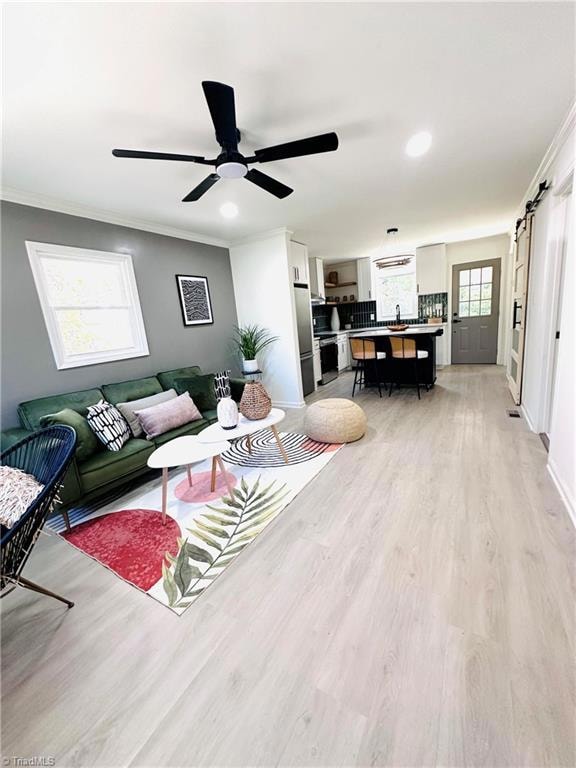
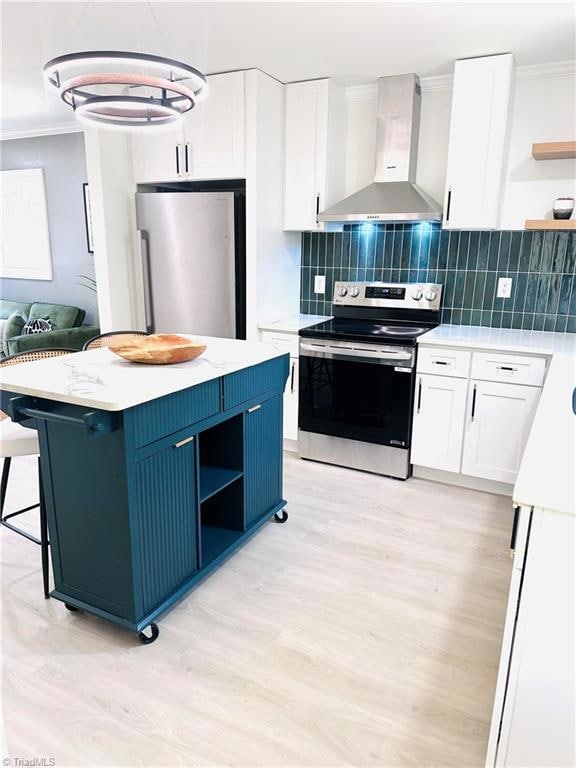
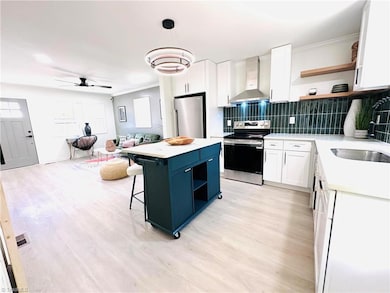
Modern, cozy, affordable, and conveniently-located— this efficient home has so much to offer! With beautifully upgraded kitchen and bathrooms, there’s so much to love. Custom tile showers, soft-close cabinetry, new stainless steel appliances, and quartz counters. New windows, hvac unit, roof, and water heater provide peace of mind. In-unit laundry provides convenience. New flooring, fresh paint, new light fixtures, and new doors. Beautiful mobile island and all appliances convey. TWO driveways! No HOA! With High Point University at the end of the street and the heart of downtown in walking distance, this home is in a great location for those looking to own as a primary home or to invest.Come see today just how beautiful efficient living can be!
Home Details
Home Type
- Single Family
Year Built
- Built in 1965
Lot Details
- 8,712 Sq Ft Lot
- Lot Dimensions are 66 x 147 x 10 x 162
- Property is zoned RS-7
Parking
- Driveway
Home Design
- Vinyl Siding
Interior Spaces
- 689 Sq Ft Home
- Property has 1 Level
Bedrooms and Bathrooms
- 2 Bedrooms
- 2 Full Bathrooms
Utilities
- Central Air
- Heat Pump System
- Electric Water Heater
Community Details
- No Home Owners Association
Listing and Financial Details
- Assessor Parcel Number 0190528
- 4% Total Tax Rate
Map
Home Values in the Area
Average Home Value in this Area
Tax History
| Year | Tax Paid | Tax Assessment Tax Assessment Total Assessment is a certain percentage of the fair market value that is determined by local assessors to be the total taxable value of land and additions on the property. | Land | Improvement |
|---|---|---|---|---|
| 2025 | $759 | $55,100 | $12,000 | $43,100 |
| 2024 | $759 | $55,100 | $12,000 | $43,100 |
| 2023 | $759 | $55,100 | $12,000 | $43,100 |
| 2022 | $743 | $55,100 | $12,000 | $43,100 |
| 2021 | $693 | $50,300 | $12,000 | $38,300 |
| 2020 | $693 | $50,300 | $12,000 | $38,300 |
| 2019 | $693 | $50,300 | $0 | $0 |
| 2018 | $690 | $50,300 | $0 | $0 |
| 2017 | $693 | $50,300 | $0 | $0 |
| 2016 | $725 | $51,700 | $0 | $0 |
| 2015 | $364 | $51,700 | $0 | $0 |
| 2014 | $371 | $51,700 | $0 | $0 |
Property History
| Date | Event | Price | List to Sale | Price per Sq Ft |
|---|---|---|---|---|
| 11/10/2025 11/10/25 | Pending | -- | -- | -- |
| 11/04/2025 11/04/25 | For Sale | $174,900 | -- | $254 / Sq Ft |
Purchase History
| Date | Type | Sale Price | Title Company |
|---|---|---|---|
| Quit Claim Deed | -- | None Listed On Document | |
| Quit Claim Deed | -- | None Listed On Document | |
| Warranty Deed | $32,000 | None Listed On Document |
Mortgage History
| Date | Status | Loan Amount | Loan Type |
|---|---|---|---|
| Open | $88,000 | Construction |
Source: Triad MLS
MLS Number: 1201215
APN: 0190528
Disclaimer: Certain information contained herein is derived from information provided by parties other than Homes.com. All information provided is deemed reliable, but is not guaranteed to be accurate and should be independently verified.
![]() Copyright 2025 Triad MLS, Inc. All rights reserved. IDX information is provided exclusively for personal, non-commercial use, and may not be used for any purpose other than to identify prospective properties consumers may be interested in purchasing. Information is deemed reliable but not guaranteed. This site will be monitored for ‘scraping’ and any use of search facilities of data on the site other than by potential buyers/sellers is prohibited. All Sale data is for informational purposes only and is not an indication of a market analysis or appraisal. Properties marked with the Triad MLS, Inc. icon are provided courtesy of the Triad MLS, Inc.’s, Internet Data Exchange Database.
Copyright 2025 Triad MLS, Inc. All rights reserved. IDX information is provided exclusively for personal, non-commercial use, and may not be used for any purpose other than to identify prospective properties consumers may be interested in purchasing. Information is deemed reliable but not guaranteed. This site will be monitored for ‘scraping’ and any use of search facilities of data on the site other than by potential buyers/sellers is prohibited. All Sale data is for informational purposes only and is not an indication of a market analysis or appraisal. Properties marked with the Triad MLS, Inc. icon are provided courtesy of the Triad MLS, Inc.’s, Internet Data Exchange Database.
- 905 Mint Ave
- 828 Willow Place
- 506 Denny St
- 837 Willow Place
- 509 Woodrow Ave
- 505 Forrest St
- 114 Eccles Place
- 719 Forrest St
- 313 Woodrow Ave
- 805 Granby Ave
- 1528 Graves Ave
- 326 Louise Ave
- 803 Granby Ave
- 1201 Pearson Place
- 206 Louise Ave
- 1224 S Downing St
- 402 Walnut St
- 1728 Brooks Ave
- 523/525 Smith St
- 1508 Boundary Ave
