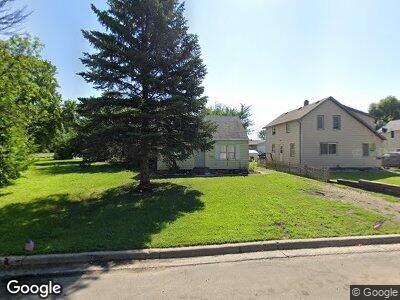
410 9th St S Breckenridge, MN 56520
Estimated Value: $76,000 - $154,000
--
Bed
--
Bath
800
Sq Ft
$141/Sq Ft
Est. Value
About This Home
This home is located at 410 9th St S, Breckenridge, MN 56520 and is currently estimated at $112,920, approximately $141 per square foot. 410 9th St S is a home with nearby schools including Breckenridge Elementary School, Breckenridge Middle School, and Breckenridge Senior High School.
Ownership History
Date
Name
Owned For
Owner Type
Purchase Details
Closed on
Mar 5, 2025
Sold by
B & B Property Mgmt Co Llc
Bought by
Spaulding Taylor
Current Estimated Value
Purchase Details
Closed on
Nov 4, 2022
Sold by
Jm Property Development Llc
Bought by
B & B Property Management Co Llc
Purchase Details
Closed on
Oct 18, 2010
Sold by
Olson Frances
Bought by
Jp Property Development Llc
Home Financials for this Owner
Home Financials are based on the most recent Mortgage that was taken out on this home.
Original Mortgage
$12,325
Interest Rate
4.36%
Mortgage Type
Stand Alone First
Create a Home Valuation Report for This Property
The Home Valuation Report is an in-depth analysis detailing your home's value as well as a comparison with similar homes in the area
Home Values in the Area
Average Home Value in this Area
Purchase History
| Date | Buyer | Sale Price | Title Company |
|---|---|---|---|
| Spaulding Taylor | $15,000 | None Listed On Document | |
| B & B Property Management Co Llc | $500 | None Listed On Document | |
| Jp Property Development Llc | -- | -- |
Source: Public Records
Mortgage History
| Date | Status | Borrower | Loan Amount |
|---|---|---|---|
| Previous Owner | Jp Property Development Llc | $12,325 |
Source: Public Records
Tax History Compared to Growth
Tax History
| Year | Tax Paid | Tax Assessment Tax Assessment Total Assessment is a certain percentage of the fair market value that is determined by local assessors to be the total taxable value of land and additions on the property. | Land | Improvement |
|---|---|---|---|---|
| 2024 | $714 | $43,800 | $7,100 | $36,700 |
| 2023 | $688 | $57,800 | $6,500 | $51,300 |
| 2022 | $652 | $52,200 | $6,500 | $45,700 |
| 2021 | $630 | $46,000 | $5,300 | $40,700 |
| 2020 | $606 | $45,400 | $5,300 | $40,100 |
| 2019 | $528 | $44,600 | $5,300 | $39,300 |
| 2018 | $516 | $37,300 | $5,300 | $32,000 |
| 2017 | $520 | $35,900 | $0 | $0 |
| 2016 | $468 | $0 | $0 | $0 |
| 2015 | $448 | $0 | $0 | $0 |
| 2014 | -- | $0 | $0 | $0 |
Source: Public Records
Map
Nearby Homes