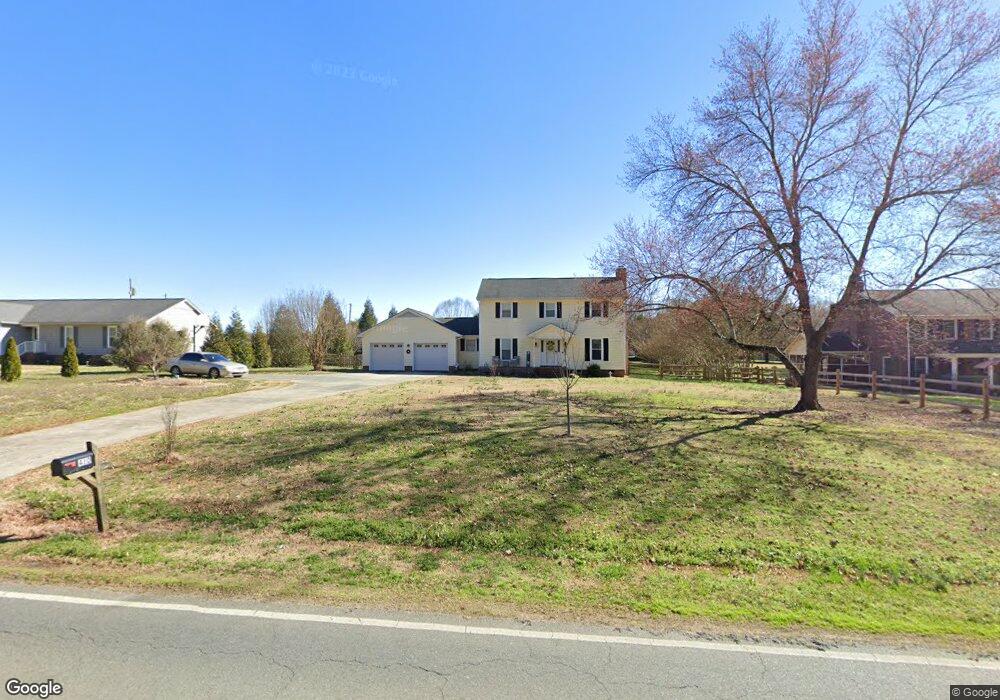
410 Baucom Deese Rd Monroe, NC 28110
Estimated Value: $378,000 - $469,000
3
Beds
3
Baths
1,843
Sq Ft
$224/Sq Ft
Est. Value
About This Home
This home is located at 410 Baucom Deese Rd, Monroe, NC 28110 and is currently estimated at $413,673, approximately $224 per square foot. 410 Baucom Deese Rd is a home located in Union County with nearby schools including Unionville Elementary School, Piedmont Middle School, and Piedmont High School.
Ownership History
Date
Name
Owned For
Owner Type
Purchase Details
Closed on
Aug 26, 2019
Sold by
Fisher Cynthia Houser and Maier Cynthia Houser
Bought by
Fisher Cynthia Houser
Current Estimated Value
Home Financials for this Owner
Home Financials are based on the most recent Mortgage that was taken out on this home.
Original Mortgage
$169,068
Outstanding Balance
$147,428
Interest Rate
3.7%
Mortgage Type
New Conventional
Estimated Equity
$266,245
Purchase Details
Closed on
Mar 29, 2007
Sold by
Helms Anthony C and Helms Sandra E
Bought by
Maier Cynthia Houser
Home Financials for this Owner
Home Financials are based on the most recent Mortgage that was taken out on this home.
Original Mortgage
$124,000
Interest Rate
6.27%
Mortgage Type
Unknown
Create a Home Valuation Report for This Property
The Home Valuation Report is an in-depth analysis detailing your home's value as well as a comparison with similar homes in the area
Home Values in the Area
Average Home Value in this Area
Purchase History
| Date | Buyer | Sale Price | Title Company |
|---|---|---|---|
| Fisher Cynthia Houser | -- | None Available | |
| Maier Cynthia Houser | $155,000 | Chicago Title Insurance Co |
Source: Public Records
Mortgage History
| Date | Status | Borrower | Loan Amount |
|---|---|---|---|
| Open | Fisher Cynthia Houser | $169,068 | |
| Closed | Maier Cynthia Houser | $124,000 |
Source: Public Records
Tax History Compared to Growth
Tax History
| Year | Tax Paid | Tax Assessment Tax Assessment Total Assessment is a certain percentage of the fair market value that is determined by local assessors to be the total taxable value of land and additions on the property. | Land | Improvement |
|---|---|---|---|---|
| 2025 | $1,492 | $293,600 | $0 | $0 |
| 2024 | $1,657 | $245,200 | $39,900 | $205,300 |
| 2023 | $1,641 | $245,200 | $39,900 | $205,300 |
| 2022 | $1,641 | $245,200 | $39,900 | $205,300 |
| 2021 | $1,642 | $245,200 | $39,900 | $205,300 |
| 2020 | $1,220 | $157,230 | $26,930 | $130,300 |
| 2019 | $1,280 | $157,230 | $26,930 | $130,300 |
| 2018 | $1,249 | $157,230 | $26,930 | $130,300 |
| 2017 | $1,328 | $157,200 | $26,900 | $130,300 |
| 2016 | $1,305 | $157,230 | $26,930 | $130,300 |
| 2015 | $1,321 | $157,230 | $26,930 | $130,300 |
| 2014 | $1,112 | $157,900 | $29,900 | $128,000 |
Source: Public Records
Map
Nearby Homes
- 411 Baucom Deese Rd
- 626 Deese Rd
- 2712 Trinity St
- 2823 Aubrey St Unit 94
- 1823 Quiet Woods Rd
- 329 Knotty Wood Dr
- 1913 Quiet Woods Rd
- 333 Knotty Woods Dr
- 329 Knotty Woods Dr
- 346 Maidstone Dr
- Plan 2177 Modeled at Wellington Pointe - Classic Series
- Plan 3147 at Wellington Pointe - Executive Series
- Plan 1602 Modeled at Wellington Pointe - Classic Series
- Plan 2939 at Wellington Pointe - Executive Series
- Plan 3147 at Wellington Pointe - Classic Series
- Plan 2539 Modeled at Wellington Pointe - Classic Series
- Plan 2336 at Wellington Pointe - Executive Series
- Plan 2723 at Wellington Pointe - Classic Series
- Plan 1910 Modeled at Wellington Pointe - Executive Series
- Plan 2539 Modeled at Wellington Pointe - Executive Series
- 408 Baucom Deese Rd
- 408 Baucom Deese Rd Unit 2
- 412 Baucom Deese Rd
- 2804 Reece Rd
- 000 Baucom Deese Rd
- 418 Baucom Deese Rd
- 404 Baucom Deese Rd
- 2802 Reece Rd
- 417 Baucom Deese Rd
- 424 Baucom Deese Rd
- 3340 Emerald Pointe Ct Unit 4
- 326 Baucom Deese Rd
- 2803 Reece Rd
- 2801 Reece Rd
- 405 Baucom Deese Rd
- 2800 Reece Rd
- 325 Baucom Deese Rd
- 3345 Emerald Pointe Ct Unit 6
- 426 Baucom Deese Rd
- 3341 Emerald Pointe Ct