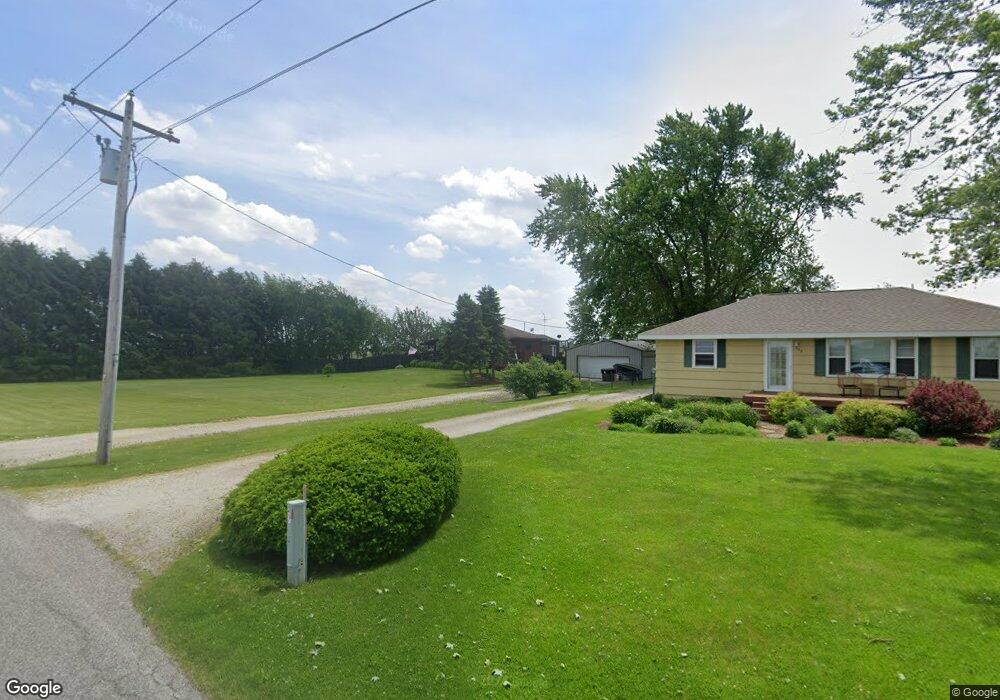
410 E 400 S Valparaiso, IN 46383
Porter County NeighborhoodEstimated Value: $282,000 - $384,000
2
Beds
2
Baths
1,594
Sq Ft
$199/Sq Ft
Est. Value
About This Home
This home is located at 410 E 400 S, Valparaiso, IN 46383 and is currently estimated at $317,354, approximately $199 per square foot. 410 E 400 S is a home located in Porter County with nearby schools including Morgan Township Elementary School and Morgan Township Middle/High School.
Ownership History
Date
Name
Owned For
Owner Type
Purchase Details
Closed on
Nov 26, 2007
Sold by
Whitledge Glenn A and Westerhout Melissa M
Bought by
Whitledge Glenn A
Current Estimated Value
Purchase Details
Closed on
Jun 16, 2005
Sold by
Marion Michael J
Bought by
Whitledge Glenn A and Westerhout Melissa M
Home Financials for this Owner
Home Financials are based on the most recent Mortgage that was taken out on this home.
Original Mortgage
$119,000
Outstanding Balance
$59,803
Interest Rate
5.68%
Mortgage Type
Fannie Mae Freddie Mac
Estimated Equity
$257,551
Create a Home Valuation Report for This Property
The Home Valuation Report is an in-depth analysis detailing your home's value as well as a comparison with similar homes in the area
Home Values in the Area
Average Home Value in this Area
Purchase History
| Date | Buyer | Sale Price | Title Company |
|---|---|---|---|
| Whitledge Glenn A | -- | None Available | |
| Whitledge Glenn A | -- | Ticor Title Ins |
Source: Public Records
Mortgage History
| Date | Status | Borrower | Loan Amount |
|---|---|---|---|
| Open | Whitledge Glenn A | $119,000 |
Source: Public Records
Tax History
| Year | Tax Paid | Tax Assessment Tax Assessment Total Assessment is a certain percentage of the fair market value that is determined by local assessors to be the total taxable value of land and additions on the property. | Land | Improvement |
|---|---|---|---|---|
| 2025 | $1,847 | $278,500 | $65,200 | $213,300 |
| 2024 | $1,714 | $281,400 | $39,300 | $242,100 |
| 2023 | $1,574 | $251,700 | $34,500 | $217,200 |
| 2022 | $1,500 | $227,000 | $34,500 | $192,500 |
| 2021 | $1,472 | $201,000 | $34,500 | $166,500 |
| 2020 | $1,339 | $186,300 | $30,000 | $156,300 |
| 2019 | $1,279 | $174,300 | $30,000 | $144,300 |
| 2018 | $1,193 | $166,500 | $30,000 | $136,500 |
| 2017 | $1,162 | $164,600 | $30,000 | $134,600 |
| 2016 | $1,050 | $155,100 | $30,700 | $124,400 |
| 2014 | $946 | $143,300 | $29,700 | $113,600 |
| 2013 | -- | $136,100 | $30,000 | $106,100 |
Source: Public Records
Map
Nearby Homes
- 6775 E 103rd Ln
- 323 E 124 S
- 645 S 150 E
- 421 Amy Rose Ln
- 430 Oak Breeze Dr
- 124 S Smoke Rd
- 103 Mckinley St
- 204 N Main St
- 829 S Baums Bridge Rd
- Lot B4-5 St Road 8
- 14244 S 1050 W
- 0 Vanessa Way Unit GNR544729
- 0 Sharyn St Unit GNR544743
- 0 Sharyn St Unit GNR544737
- 0 Sharyn St Unit GNR544741
- 401 Sutton Ave
- 401 S Sutton Ave
- 708 S Main St
- 308 E Ross Ave
- 87 Kaper Ln
Your Personal Tour Guide
Ask me questions while you tour the home.