Estimated Value: $95,879 - $127,000
3
Beds
--
Bath
1,152
Sq Ft
$101/Sq Ft
Est. Value
About This Home
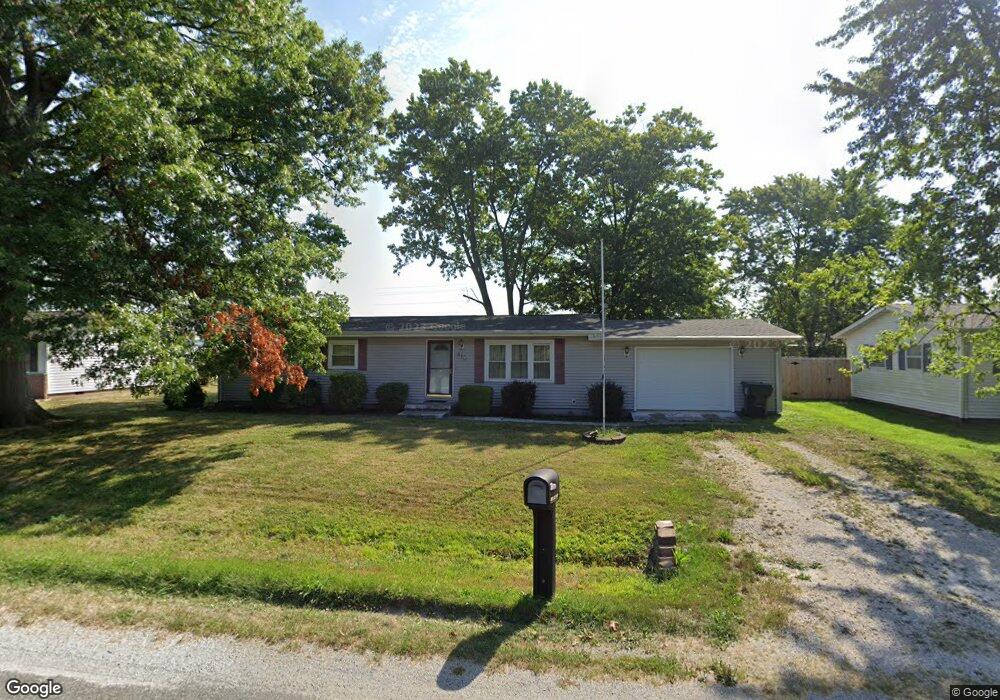
This home is located at 410 NE 14th St, Casey, IL 62420 and is currently estimated at $116,220, approximately $100 per square foot. 410 NE 14th St is a home located in Clark County with nearby schools including Monroe Elementary School and Casey-Westfield Jr-Sr High School.
Ownership History
Date
Name
Owned For
Owner Type
Purchase Details
Closed on
Apr 9, 2012
Sold by
Anderson Carl D and Anderson Mary Jane
Bought by
Brown Dale W
Current Estimated Value
Home Financials for this Owner
Home Financials are based on the most recent Mortgage that was taken out on this home.
Original Mortgage
$52,000
Outstanding Balance
$21,757
Interest Rate
3.92%
Mortgage Type
New Conventional
Estimated Equity
$94,463
Purchase Details
Closed on
Aug 28, 2009
Sold by
Mitchell Jeffrey W and Mitchell Karen J
Bought by
Anderson Carl D and Anderson Mary Jane
Purchase Details
Closed on
May 14, 2009
Sold by
Easton Travis M and Easton Tiffany M
Bought by
Mitchell Jeffrey W and Mitchell Karen J
Purchase Details
Closed on
Jun 15, 2006
Sold by
Bonner Justin D and Bonner Lynsey K
Bought by
Easton Travis M
Home Financials for this Owner
Home Financials are based on the most recent Mortgage that was taken out on this home.
Original Mortgage
$73,500
Interest Rate
6.49%
Mortgage Type
New Conventional
Create a Home Valuation Report for This Property
The Home Valuation Report is an in-depth analysis detailing your home's value as well as a comparison with similar homes in the area
Home Values in the Area
Average Home Value in this Area
Purchase History
| Date | Buyer | Sale Price | Title Company |
|---|---|---|---|
| Brown Dale W | $65,000 | None Available | |
| Anderson Carl D | $75,000 | None Available | |
| Mitchell Jeffrey W | $75,333 | None Available | |
| Easton Travis M | $73,500 | None Available |
Source: Public Records
Mortgage History
| Date | Status | Borrower | Loan Amount |
|---|---|---|---|
| Open | Brown Dale W | $52,000 | |
| Previous Owner | Easton Travis M | $73,500 |
Source: Public Records
Tax History Compared to Growth
Tax History
| Year | Tax Paid | Tax Assessment Tax Assessment Total Assessment is a certain percentage of the fair market value that is determined by local assessors to be the total taxable value of land and additions on the property. | Land | Improvement |
|---|---|---|---|---|
| 2024 | $2,052 | $31,626 | $4,114 | $27,512 |
| 2023 | $1,953 | $31,626 | $4,114 | $27,512 |
| 2022 | $1,943 | $28,237 | $3,673 | $24,564 |
| 2021 | $1,983 | $28,237 | $3,673 | $24,564 |
| 2020 | $1,737 | $24,339 | $3,673 | $20,666 |
| 2019 | $1,737 | $24,339 | $3,673 | $20,666 |
| 2018 | $1,759 | $24,339 | $3,673 | $20,666 |
| 2017 | $1,782 | $24,891 | $3,756 | $21,135 |
| 2016 | $1,779 | $23,510 | $2,550 | $20,960 |
| 2015 | $2,286 | $24,154 | $2,620 | $21,534 |
| 2014 | $2,251 | $23,510 | $2,550 | $20,960 |
| 2013 | $2,251 | $22,715 | $2,465 | $20,250 |
Source: Public Records
Map
Nearby Homes
- 509 NE 2nd St
- 0 Illinois 49
- 408 E Adams Ave
- 0 Highway 40 W
- 9 W Florida Ave
- 402 SE 7th St
- 606 E Monroe Ave
- 100 E Madison Ave
- 112 NW 4th St
- 305 E Van Buren Ave
- 205 W Madison Ave
- 107 W Van Buren Ave
- 831 County Road 2480e
- 20 Ashley Ln
- 688a County Road 2150e
- 0 Randall St
- 0 Cumberland St
- N 880th St
- 502 E Cumberland St
- 503 E Ohio St
- 412 NE 14th St
- 408 NE 14th St
- 411 NE 15th St
- 409 NE 15th St
- 413 NE 15th St
- 406 NE 14th St
- 413 NE 14th St
- 409 NE 14th St
- 407 NE 15th St
- 407 NE 14th St
- 404 NE 14th St
- 405 NE 15th St
- 408 NE 15th St
- 412 NE 13th St
- 408 NE 13th St
- 402 NE 14th St
- 403 NE 15th St
- 403 NE 14th St
- 400 NE 14th St
- 1402 E Florida Ave