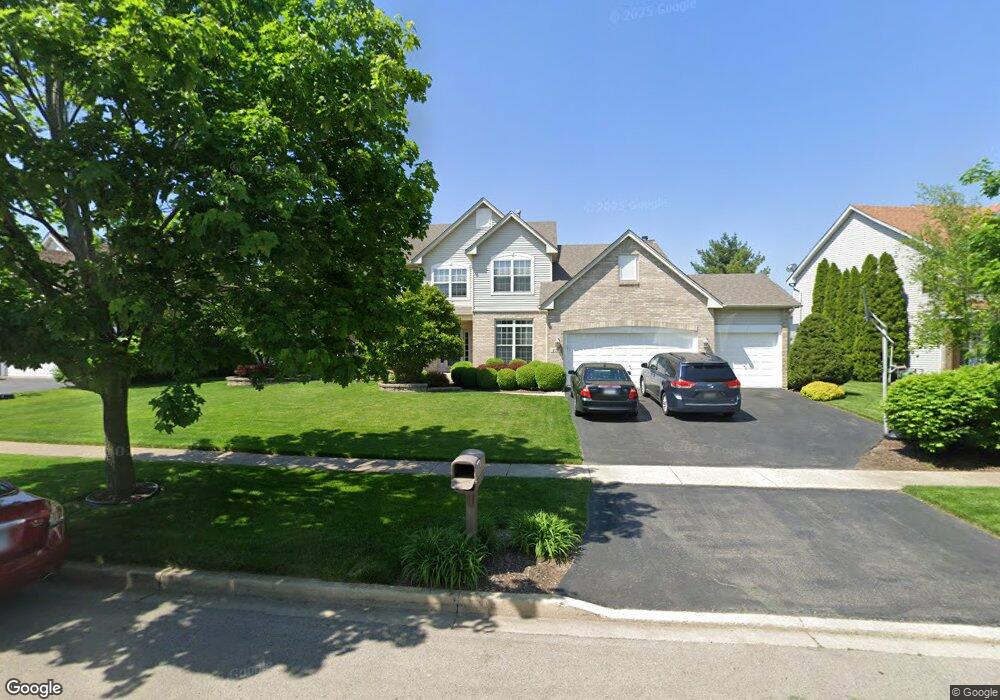
410 Stonewater Ln Oswego, IL 60543
Northwest Oswego NeighborhoodEstimated Value: $483,000 - $519,000
3
Beds
3
Baths
2,935
Sq Ft
$168/Sq Ft
Est. Value
About This Home
This home is located at 410 Stonewater Ln, Oswego, IL 60543 and is currently estimated at $493,262, approximately $168 per square foot. 410 Stonewater Ln is a home located in Kendall County with nearby schools including Fox Chase Elementary School, Traughber Junior High School, and Oswego High School.
Ownership History
Date
Name
Owned For
Owner Type
Purchase Details
Closed on
Jun 29, 2006
Sold by
Ingram Randy F and Ingram Linda M
Bought by
Nowak James E and Nowak Melissa A
Current Estimated Value
Home Financials for this Owner
Home Financials are based on the most recent Mortgage that was taken out on this home.
Original Mortgage
$37,000
Interest Rate
6.31%
Mortgage Type
Stand Alone Second
Purchase Details
Closed on
May 2, 2001
Sold by
The Old Second National Bank Of Aurora
Bought by
Ingram Randy F and Ingram Linda M
Home Financials for this Owner
Home Financials are based on the most recent Mortgage that was taken out on this home.
Original Mortgage
$190,000
Interest Rate
7.18%
Create a Home Valuation Report for This Property
The Home Valuation Report is an in-depth analysis detailing your home's value as well as a comparison with similar homes in the area
Home Values in the Area
Average Home Value in this Area
Purchase History
| Date | Buyer | Sale Price | Title Company |
|---|---|---|---|
| Nowak James E | $335,000 | Multiple | |
| Ingram Randy F | $282,000 | Ticor Title Insurance Compan |
Source: Public Records
Mortgage History
| Date | Status | Borrower | Loan Amount |
|---|---|---|---|
| Closed | Nowak James E | $37,000 | |
| Open | Nowak James E | $251,250 | |
| Previous Owner | Ingram Randy F | $190,000 |
Source: Public Records
Tax History Compared to Growth
Tax History
| Year | Tax Paid | Tax Assessment Tax Assessment Total Assessment is a certain percentage of the fair market value that is determined by local assessors to be the total taxable value of land and additions on the property. | Land | Improvement |
|---|---|---|---|---|
| 2024 | $10,665 | $138,529 | $27,628 | $110,901 |
| 2023 | $9,347 | $120,460 | $24,024 | $96,436 |
| 2022 | $9,347 | $109,509 | $21,840 | $87,669 |
| 2021 | $9,291 | $105,297 | $21,000 | $84,297 |
| 2020 | $8,594 | $96,950 | $20,000 | $76,950 |
| 2019 | $8,959 | $99,330 | $20,000 | $79,330 |
| 2018 | $9,162 | $100,491 | $22,347 | $78,144 |
| 2017 | $8,880 | $92,618 | $20,596 | $72,022 |
| 2016 | $8,507 | $87,789 | $19,522 | $68,267 |
| 2015 | $8,296 | $82,046 | $18,245 | $63,801 |
| 2014 | -- | $79,657 | $17,714 | $61,943 |
| 2013 | -- | $83,849 | $18,646 | $65,203 |
Source: Public Records
Map
Nearby Homes
- 602 Clearwater Ct Unit 2
- 608 Clearwater Ct
- 338 Millstream Ln Unit 1
- 505 Parkland Ct
- 125 Presidential Blvd Unit 3248
- 403 Lake Ct
- 514 Bentson St
- 409 Fawn Dr
- 5055 U S 34
- 2350 State Route 31
- 411 Bayberry Dr
- 435 Fawn Dr
- 2110 State Route 31
- 238 Willowwood Dr
- 133 River Mist Dr Unit 3
- 1721 State Route 31
- 156 River Mist Dr
- 173 Dolores St
- 102 Mary St
- 114 Riverview Ct
- 408 Stonewater Ln Unit 1
- 412 Stonewater Ln
- 511 Clearwater Ln
- 513 Clearwater Ln
- 509 Clearwater Ln
- 406 Stonewater Ln
- 414 Stonewater Ln
- 409 Stonewater Ln Unit 1
- 411 Stonewater Ln
- 407 Stonewater Ln
- 413 Stonewater Ln
- 515 Clearwater Ln
- 507 Clearwater Ln
- 404 Stonewater Ln
- 416 Stonewater Ln
- 415 Stonewater Ln
- 517 Clearwater Ln Unit 3
- 510 Clearwater Ln
- 417 Stonewater Ln
- 316 Millstream Ln Unit 1