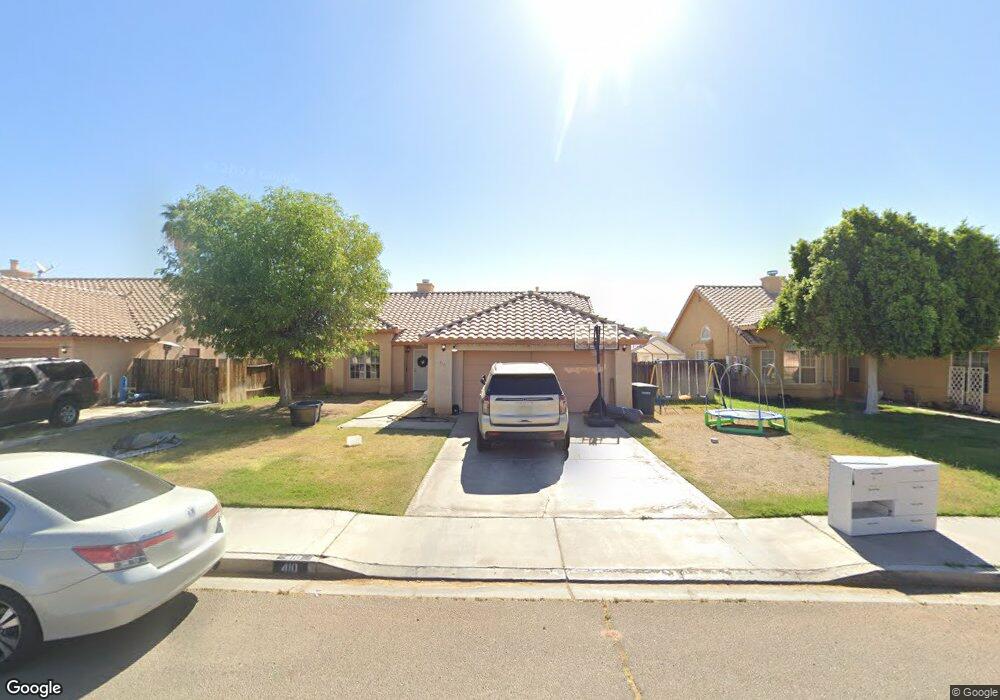
410 Tesoro Ln Blythe, CA 92225
Estimated Value: $214,000 - $276,000
4
Beds
2
Baths
1,560
Sq Ft
$164/Sq Ft
Est. Value
About This Home
This home is located at 410 Tesoro Ln, Blythe, CA 92225 and is currently estimated at $256,007, approximately $164 per square foot. 410 Tesoro Ln is a home located in Riverside County with nearby schools including Palo Verde High School and Scale Leadership Academy - East.
Ownership History
Date
Name
Owned For
Owner Type
Purchase Details
Closed on
Oct 13, 2000
Sold by
Va
Bought by
Jimenez Jose L and Jimenez Maria L
Current Estimated Value
Home Financials for this Owner
Home Financials are based on the most recent Mortgage that was taken out on this home.
Original Mortgage
$109,033
Outstanding Balance
$39,678
Interest Rate
7.89%
Mortgage Type
Seller Take Back
Estimated Equity
$216,329
Purchase Details
Closed on
Jun 2, 2000
Sold by
Chase Manhattan Mtg Corp
Bought by
Va
Purchase Details
Closed on
Apr 26, 1996
Sold by
Kravic Annette E and Keenan James T
Bought by
Phillips Michael P and Phillips Diana
Home Financials for this Owner
Home Financials are based on the most recent Mortgage that was taken out on this home.
Original Mortgage
$123,420
Interest Rate
8.32%
Mortgage Type
VA
Purchase Details
Closed on
Feb 18, 1994
Sold by
Cal Ranchos Corp
Bought by
Kravick Annette E and Keenan James T
Create a Home Valuation Report for This Property
The Home Valuation Report is an in-depth analysis detailing your home's value as well as a comparison with similar homes in the area
Home Values in the Area
Average Home Value in this Area
Purchase History
We collect this data history from publicly available records. To have your information removed, we recommend requesting removal directly through your county’s website.
| Date | Buyer | Sale Price | Title Company |
|---|---|---|---|
| Jimenez Jose L | $110,500 | First American Title Co | |
| Va | -- | Landsafe Title | |
| Chase Manhattan Mtg Corp | $114,569 | Landsafe Title | |
| Phillips Michael P | $121,500 | First American Title Ins Co | |
| Kravick Annette E | -- | First American Title Ins Co |
Source: Public Records
Mortgage History
We collect this data history from publicly available records. To have your information removed, we recommend requesting removal directly through your county’s website.
| Date | Status | Borrower | Loan Amount |
|---|---|---|---|
| Open | Jimenez Jose L | $109,033 | |
| Previous Owner | Phillips Michael P | $123,420 |
Source: Public Records
Tax History
| Year | Tax Paid | Tax Assessment Tax Assessment Total Assessment is a certain percentage of the fair market value that is determined by local assessors to be the total taxable value of land and additions on the property. | Land | Improvement |
|---|---|---|---|---|
| 2025 | $1,898 | $166,470 | $30,117 | $136,353 |
| 2023 | $1,898 | $160,008 | $28,949 | $131,059 |
| 2022 | $1,825 | $156,872 | $28,382 | $128,490 |
| 2021 | $1,779 | $153,797 | $27,826 | $125,971 |
| 2020 | $1,762 | $152,221 | $27,541 | $124,680 |
| 2019 | $1,748 | $149,237 | $27,001 | $122,236 |
| 2018 | $1,639 | $146,312 | $26,473 | $119,839 |
| 2017 | $1,607 | $143,444 | $25,954 | $117,490 |
| 2016 | $1,592 | $140,633 | $25,446 | $115,187 |
| 2015 | $1,577 | $138,522 | $25,065 | $113,457 |
| 2014 | $1,520 | $135,811 | $24,575 | $111,236 |
Source: Public Records
Map
Nearby Homes
- 421 Tesoro Ln
- 396 N Earle St
- 470 El Dorado
- 0 El Dorado
- 321 Alameda St
- 256 N Acacia Ave
- 370 N 9th St
- 340 N 9th St
- 1021 E Chanslor Way
- 184 N Acacia St
- 168 Acacia Ave
- 1011 E California St
- 975 E Avenue B
- 460 N Sola Ave
- 1367 E Hobsonway
- 630 N 10th St
- 301 N Sola Ave
- 934 E Avenue B
- 927 E Murphy St
- 1834 E Chanslor Way
Your Personal Tour Guide
Ask me questions while you tour the home.