
Seller's Agent in 2022
Bob Chew
Samson Properties
(410) 995-9600
24 in this area
2,760 Total Sales
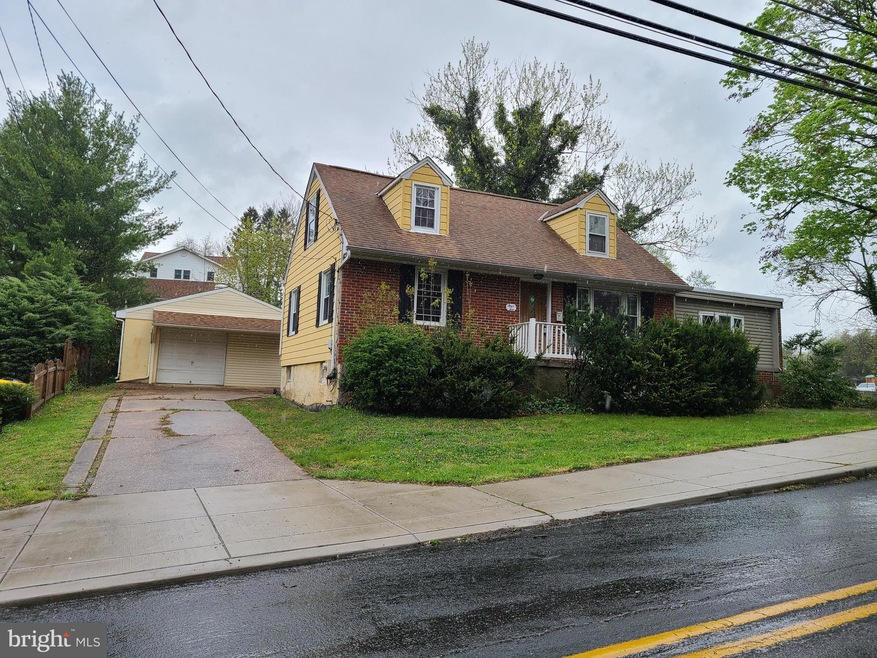
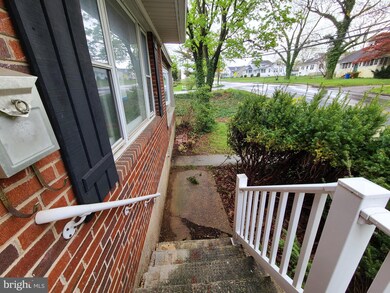

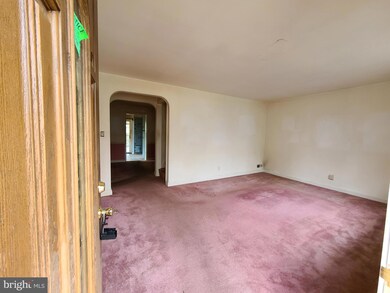
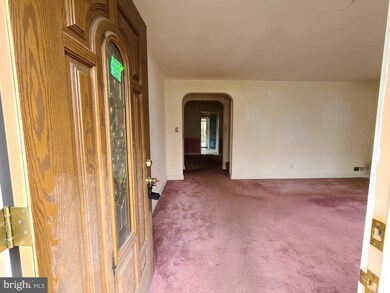
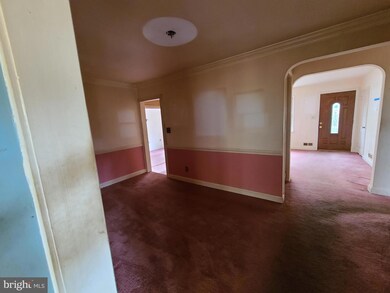
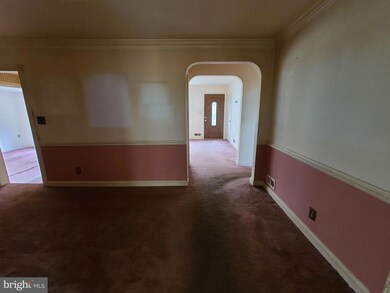
MULTIPLE OFFERS IN NOW 4/20/20. MOR CLOSED TODAY AT 1 PM. This is a Fannie Mae Reverse Mortgage Foreclosure. This spacious Cape Cod, on a corner lot is conveniently located in Linthicum Heights. The home offers 4 BR and 2 full baths. The main level features a living room, family room, 2 BRs, 1 full bath, kitchen and dining room with walk out to deck. The lower level is partially finished with plenty of room for storage. Upper level has the remaining 2 bedrooms as well as a full bath. The back yard is fantastic for entertaining, a covered porch, patio and decking!
Home Type
Est. Annual Taxes
Year Built
Lot Details
Parking
Home Design
Interior Spaces
Bedrooms and Bathrooms
Partially Finished Basement
Utilities
Community Details
Listing and Financial Details
| Date | Type | Sale Price | Title Company |
|---|---|---|---|
| Deed | $215,000 | Goldstar Title Company | |
| Trustee Deed | $300,000 | None Available |
| Date | Status | Loan Amount | Loan Type |
|---|---|---|---|
| Open | $50,000 | New Conventional | |
| Previous Owner | $510,000 | Reverse Mortgage Home Equity Conversion Mortgage | |
| Previous Owner | $40,671 | Unknown | |
| Previous Owner | $197,000 | New Conventional | |
| Previous Owner | $187,000 | New Conventional |
| Date | Event | Price | Change | Sq Ft Price |
|---|---|---|---|---|
| 01/20/2022 01/20/22 | Sold | $489,999 | 0.0% | $192 / Sq Ft |
| 12/17/2021 12/17/21 | Pending | -- | -- | -- |
| 11/26/2021 11/26/21 | Price Changed | $489,999 | -2.0% | $192 / Sq Ft |
| 10/31/2021 10/31/21 | For Sale | $499,900 | 0.0% | $196 / Sq Ft |
| 10/20/2021 10/20/21 | Pending | -- | -- | -- |
| 10/08/2021 10/08/21 | For Sale | $499,900 | +132.5% | $196 / Sq Ft |
| 05/20/2020 05/20/20 | Sold | $215,000 | +19.4% | $106 / Sq Ft |
| 04/21/2020 04/21/20 | Pending | -- | -- | -- |
| 04/14/2020 04/14/20 | For Sale | $180,000 | -- | $89 / Sq Ft |
| Year | Tax Paid | Tax Assessment Tax Assessment Total Assessment is a certain percentage of the fair market value that is determined by local assessors to be the total taxable value of land and additions on the property. | Land | Improvement |
|---|---|---|---|---|
| 2024 | $4,574 | $371,833 | $0 | $0 |
| 2023 | $4,257 | $346,467 | $0 | $0 |
| 2022 | $3,786 | $321,100 | $160,000 | $161,100 |
| 2021 | $3,684 | $311,400 | $0 | $0 |
| 2020 | $2,533 | $301,700 | $0 | $0 |
| 2019 | $2,497 | $292,000 | $142,800 | $149,200 |
| 2018 | $2,864 | $282,433 | $0 | $0 |
| 2017 | $2,609 | $272,867 | $0 | $0 |
| 2016 | -- | $263,300 | $0 | $0 |
| 2015 | -- | $263,300 | $0 | $0 |
| 2014 | -- | $263,300 | $0 | $0 |
Seller's Agent in 2022
Bob Chew
Samson Properties
(410) 995-9600
24 in this area
2,760 Total Sales
Seller Co-Listing Agent in 2022
Casey Franz
Cummings & Co. Realtors
(443) 996-0241
2 in this area
44 Total Sales
J
Buyer's Agent in 2022
Julia Morgan
Berkshire Hathaway HomeServices Homesale Realty
Seller's Agent in 2020
Michele Michael
Century 21 New Millennium
(410) 320-7600
3 in this area
90 Total Sales
Buyer's Agent in 2020
Donna Webb-Scott
Long & Foster
(410) 382-9440
4 in this area
15 Total Sales
Source: Bright MLS
MLS Number: MDAA431438
APN: 05-481-10968304
Disclaimer: Certain information contained herein is derived from information provided by parties other than Homes.com. All information provided is deemed reliable, but is not guaranteed to be accurate and should be independently verified.
![]() The data relating to real estate for sale on this website appears in part through the BRIGHT Internet Data Exchange program, a voluntary cooperative exchange of property listing data between licensed real estate brokerage firms, and is provided by BRIGHT through a licensing agreement.
The data relating to real estate for sale on this website appears in part through the BRIGHT Internet Data Exchange program, a voluntary cooperative exchange of property listing data between licensed real estate brokerage firms, and is provided by BRIGHT through a licensing agreement.
Listing information is from various brokers who participate in the Bright MLS IDX program and not all listings may be visible on the site.
The property information being provided on or through the website is for the personal, non-commercial use of consumers and such information may not be used for any purpose other than to identify prospective properties consumers may be interested in purchasing.
Some properties which appear for sale on the website may no longer be available because they are for instance, under contract, sold or are no longer being offered for sale.
Property information displayed is deemed reliable but is not guaranteed.
Copyright 2025 Bright MLS, Inc.