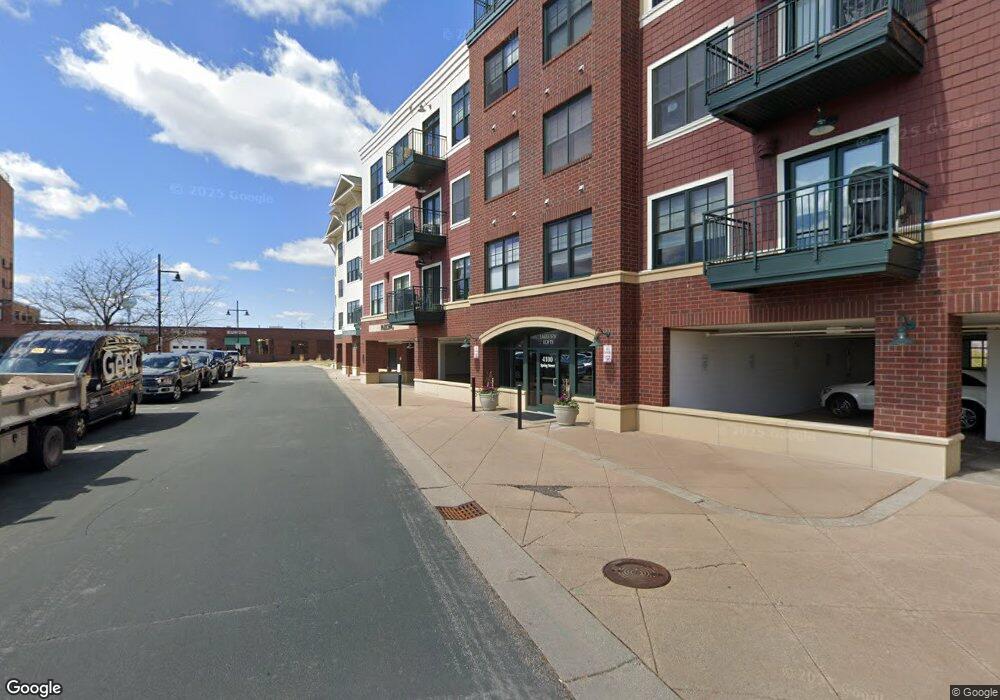
4100 Spring St Unit 214 Spring Park, MN 55384
Estimated Value: $431,673 - $459,000
2
Beds
2
Baths
1,241
Sq Ft
$359/Sq Ft
Est. Value
About This Home
This home is located at 4100 Spring St Unit 214, Spring Park, MN 55384 and is currently estimated at $445,168, approximately $358 per square foot. 4100 Spring St Unit 214 is a home located in Hennepin County with nearby schools including Hilltop Primary School, Westonka Middle School, and Westonka High School.
Ownership History
Date
Name
Owned For
Owner Type
Purchase Details
Closed on
May 18, 2018
Sold by
Beede Gretchen B
Bought by
Auger Charles D and Auger Pamela R
Current Estimated Value
Purchase Details
Closed on
Aug 7, 2017
Sold by
Beede Gretchen B and Beede David R
Bought by
Beede Gretchen B
Purchase Details
Closed on
Aug 5, 2015
Sold by
Miller Derek G and Grimes Jennifer Christine
Bought by
Beede David R and Beede Gretchen B
Home Financials for this Owner
Home Financials are based on the most recent Mortgage that was taken out on this home.
Original Mortgage
$150,000
Interest Rate
3.2%
Mortgage Type
New Conventional
Purchase Details
Closed on
Oct 27, 2008
Sold by
Hsbc Bank Usa
Bought by
Miller Derek G
Purchase Details
Closed on
Aug 30, 2006
Sold by
Lakeview Lofts Llc
Bought by
Burns Casey
Create a Home Valuation Report for This Property
The Home Valuation Report is an in-depth analysis detailing your home's value as well as a comparison with similar homes in the area
Home Values in the Area
Average Home Value in this Area
Purchase History
| Date | Buyer | Sale Price | Title Company |
|---|---|---|---|
| Auger Charles D | $315,000 | Burnet Title | |
| Beede Gretchen B | -- | None Available | |
| Beede David R | $260,000 | Trademark Title Services Inc | |
| Miller Derek G | $186,500 | -- | |
| Burns Casey | $459,900 | -- |
Source: Public Records
Mortgage History
| Date | Status | Borrower | Loan Amount |
|---|---|---|---|
| Previous Owner | Beede David R | $150,000 |
Source: Public Records
Tax History
| Year | Tax Paid | Tax Assessment Tax Assessment Total Assessment is a certain percentage of the fair market value that is determined by local assessors to be the total taxable value of land and additions on the property. | Land | Improvement |
|---|---|---|---|---|
| 2024 | $3,966 | $379,800 | $111,600 | $268,200 |
| 2023 | $4,263 | $422,100 | $150,000 | $272,100 |
| 2022 | $3,016 | $413,000 | $150,000 | $263,000 |
| 2021 | $3,237 | $290,000 | $62,000 | $228,000 |
| 2020 | $3,414 | $308,000 | $90,000 | $218,000 |
| 2019 | $3,144 | $302,000 | $65,000 | $237,000 |
| 2018 | $2,717 | $279,000 | $119,000 | $160,000 |
| 2017 | $3,037 | $255,000 | $95,000 | $160,000 |
| 2016 | $2,733 | $226,000 | $60,000 | $166,000 |
| 2015 | $2,669 | $215,000 | $49,000 | $166,000 |
| 2014 | -- | $181,000 | $15,000 | $166,000 |
Source: Public Records
Map
Nearby Homes
- 4100 Spring St Unit 211
- 4100 Spring St Unit 214
- 4100 Spring St Unit 310
- 4100 Shoreline Dr Unit S206
- 4201 Sunset Dr Unit N406
- 4201 Sunset Dr Unit N217
- 4201 Sunset Dr Unit N412
- 4201 Sunset Dr Unit N515
- 4201 Sunset Dr Unit N519
- 4201 Sunset Dr Unit N308
- 4201 Sunset Dr Unit N213
- 4201 Sunset Dr Unit N201
- 4201 Sunset Dr Unit N407
- 4201 Sunset Dr Unit N220
- 3832 Northern Ave
- 3890 Sunset Dr
- 2475 Dunwoody Ave
- 2463 Black Lake Rd
- 3706 Livingston Ave
- 3708 Northern Ave
- 4100 Spring St Unit 414
- 4100 Spring St Unit 412
- 4100 Spring St Unit 411
- 4100 Spring St Unit 410
- 4100 Spring St Unit 409
- 4100 Spring St Unit 408
- 4100 Spring St Unit 407
- 4100 Spring St Unit 406
- 4100 Spring St Unit 405
- 4100 Spring St Unit 404
- 4100 Spring St Unit 403
- 4100 Spring St Unit 402
- 4100 Spring St Unit 401
- 4100 Spring St Unit 314
- 4100 Spring St Unit 312
- 4100 Spring St Unit 311
- 4100 Spring St Unit 310
- 4100 Spring St Unit 309
- 4100 Spring St Unit 308
- 4100 Spring St Unit 307
Your Personal Tour Guide
Ask me questions while you tour the home.