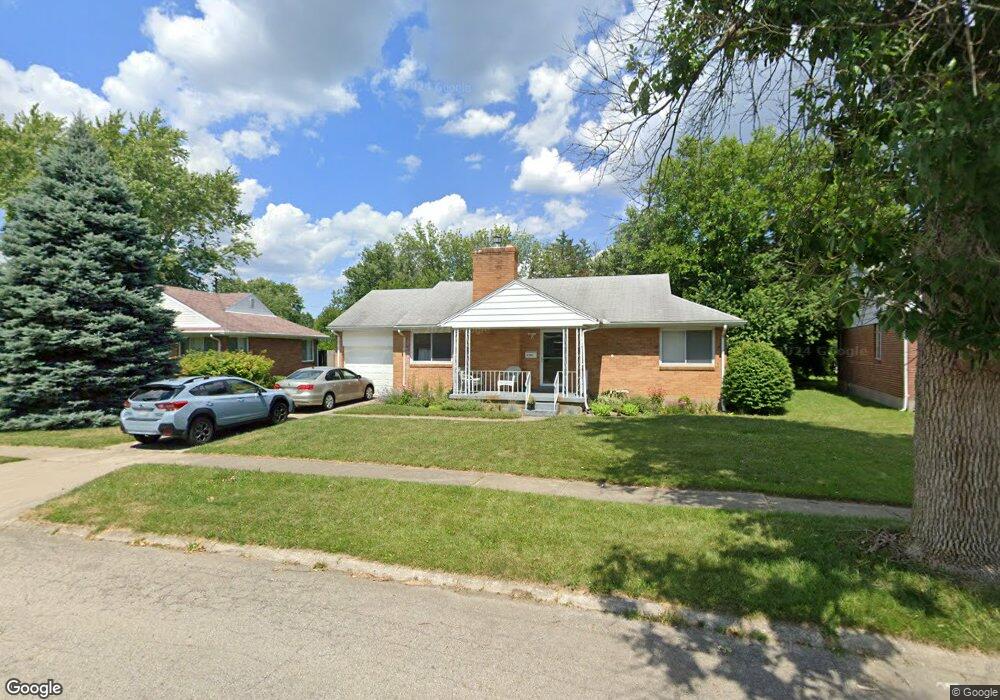
4108 Lefevre Dr Dayton, OH 45429
Estimated Value: $190,504 - $224,000
2
Beds
1
Bath
950
Sq Ft
$216/Sq Ft
Est. Value
About This Home
This home is located at 4108 Lefevre Dr, Dayton, OH 45429 and is currently estimated at $205,626, approximately $216 per square foot. 4108 Lefevre Dr is a home located in Montgomery County with nearby schools including Oakview Elementary School, Van Buren Middle School, and Kettering Fairmont High School.
Ownership History
Date
Name
Owned For
Owner Type
Purchase Details
Closed on
Jul 13, 2016
Sold by
Damrell Jason L
Bought by
Borders Joseph D and Borders Morgan R
Current Estimated Value
Home Financials for this Owner
Home Financials are based on the most recent Mortgage that was taken out on this home.
Original Mortgage
$99,750
Outstanding Balance
$79,037
Interest Rate
3.6%
Mortgage Type
New Conventional
Estimated Equity
$126,589
Purchase Details
Closed on
Apr 8, 2013
Sold by
Pnc Bank Na
Bought by
Damrell Jason L
Home Financials for this Owner
Home Financials are based on the most recent Mortgage that was taken out on this home.
Original Mortgage
$41,600
Interest Rate
3.56%
Mortgage Type
Future Advance Clause Open End Mortgage
Purchase Details
Closed on
Feb 1, 2013
Sold by
King Amy A
Bought by
Pnc Mortgage Na
Purchase Details
Closed on
Dec 18, 2012
Sold by
King Amy A and King Volley B
Bought by
Pnc Bank Na
Purchase Details
Closed on
Jul 5, 1995
Sold by
Evans Anita M
Bought by
King Volley B and King Amy A
Create a Home Valuation Report for This Property
The Home Valuation Report is an in-depth analysis detailing your home's value as well as a comparison with similar homes in the area
Home Values in the Area
Average Home Value in this Area
Purchase History
| Date | Buyer | Sale Price | Title Company |
|---|---|---|---|
| Borders Joseph D | $105,000 | Sterling Title Inc | |
| Damrell Jason L | $52,000 | None Available | |
| Pnc Mortgage Na | $56,000 | None Available | |
| Pnc Bank Na | $56,000 | None Available | |
| King Volley B | -- | -- |
Source: Public Records
Mortgage History
| Date | Status | Borrower | Loan Amount |
|---|---|---|---|
| Open | Borders Joseph D | $99,750 | |
| Closed | Damrell Jason L | $41,600 |
Source: Public Records
Tax History
| Year | Tax Paid | Tax Assessment Tax Assessment Total Assessment is a certain percentage of the fair market value that is determined by local assessors to be the total taxable value of land and additions on the property. | Land | Improvement |
|---|---|---|---|---|
| 2025 | $3,554 | $55,430 | $14,610 | $40,820 |
| 2024 | $3,453 | $55,430 | $14,610 | $40,820 |
| 2023 | $3,453 | $55,430 | $14,610 | $40,820 |
| 2022 | $3,292 | $41,770 | $10,990 | $30,780 |
| 2021 | $3,046 | $41,770 | $10,990 | $30,780 |
| 2020 | $3,056 | $41,770 | $10,990 | $30,780 |
| 2019 | $2,614 | $31,540 | $9,990 | $21,550 |
| 2018 | $2,628 | $31,540 | $9,990 | $21,550 |
| 2017 | $2,421 | $31,540 | $9,990 | $21,550 |
| 2016 | $2,301 | $28,140 | $9,990 | $18,150 |
| 2015 | $2,199 | $28,140 | $9,990 | $18,150 |
| 2014 | $2,199 | $28,140 | $9,990 | $18,150 |
| 2012 | -- | $27,390 | $9,900 | $17,490 |
Source: Public Records
Map
Nearby Homes
- 804 Hollendale Dr
- 4008 Ackerman Blvd
- 3826 California Ave
- 817 Lovetta Dr
- 3854 Shroyer Rd
- 3737 Saranac Dr
- 1905 Tait Rd
- 3716 Wenzler Dr
- 639 Storms Rd
- 500 Schuyler Dr
- 4359 Sunnydale Place
- 1105 Chateau Dr
- 1108 Chateau Dr
- 4541 Acreview Ln
- 4432 Renwood Dr
- 326 N Bromfield Rd
- 117 Balmoral Dr
- 889 Timberlake Ct
- 876 Timberlake Ct
- 791 Ashton Cir Unit 103
- 4112 Lefevre Dr
- 4104 Lefevre Dr
- 708 Lefevre Cir
- 4116 Lefevre Dr
- 4029 Maricarr Dr
- 4025 Maricarr Dr
- 4100 Lefevre Dr
- 4101 Maricarr Dr
- 4021 Maricarr Dr
- 716 Lefevre Cir
- 4105 Maricarr Dr
- 4111 Lefevre Dr
- 4120 Lefevre Dr
- 4115 Lefevre Dr
- 4017 Maricarr Dr
- 4107 Lefevre Dr
- 4109 Maricarr Dr
- 4119 Lefevre Dr
- 4013 Maricarr Dr
- 4124 Lefevre Dr
Your Personal Tour Guide
Ask me questions while you tour the home.