
Seller's Agent in 2023
Miki Nakajima
Russ Lyon Sotheby's International Realty
(928) 777-3225
7 in this area
40 Total Sales
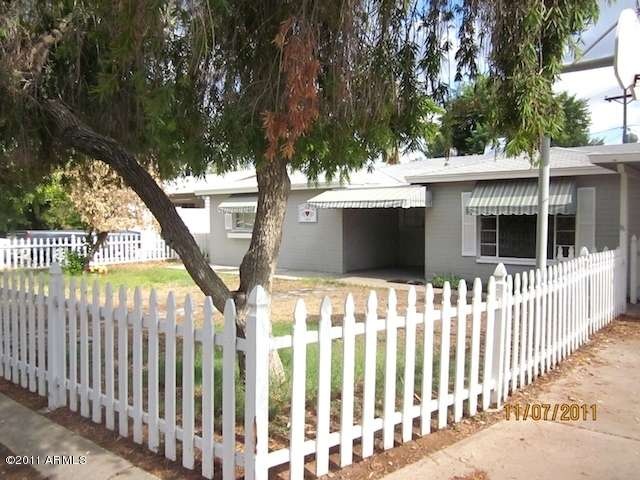
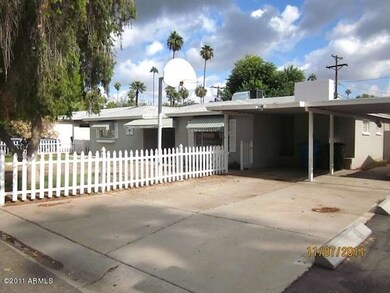
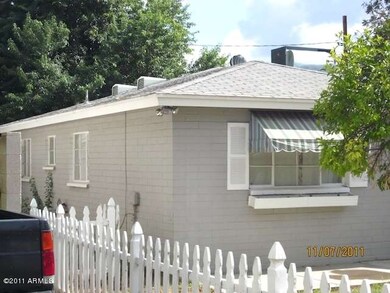
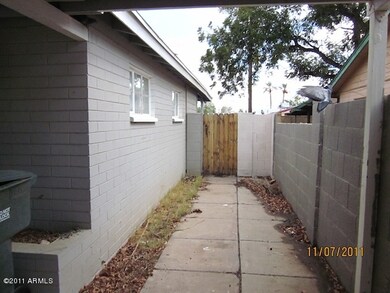
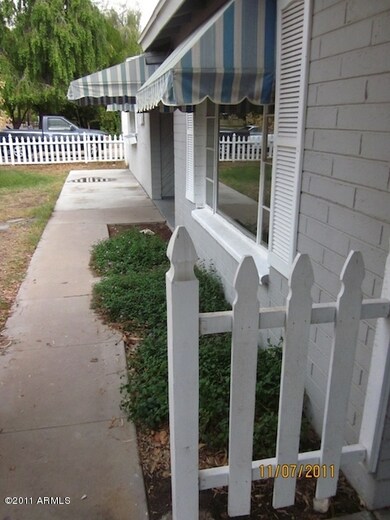
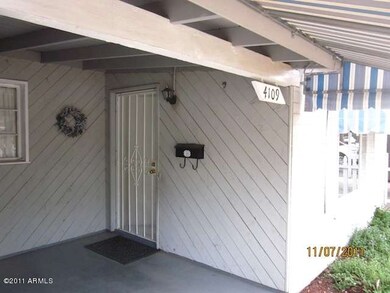
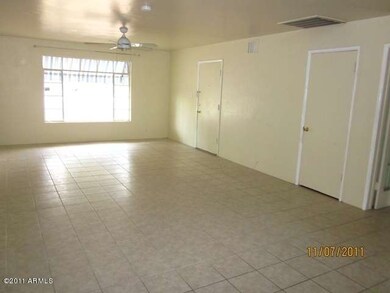
THIS MASONRY 3 BED 2.5 BATH HOME IS BRIGHT AND HAS 2 LARGE SEPARATE LIVING AREA *FAMILY ROOM HAS FIREPLACE AND ACCESS TO INSIDE LARGE STORAGE ROOM* NEWER A/C WITH COVERED PATIO* PROPERTY IS IN GOOD CONDITION WITH TILE FLOORS THROUGH OUT *VIEW PHOTOS Purchase this property for as little as 3% down!
Last Agent to Sell the Property
My Home Group Real Estate License #SA024831000 Listed on: 11/16/2011
| Date | Type | Sale Price | Title Company |
|---|---|---|---|
| Warranty Deed | -- | None Listed On Document | |
| Warranty Deed | $607,000 | First American Title Ins Co | |
| Warranty Deed | $349,900 | Empire West Title Agency | |
| Cash Sale Deed | $285,500 | Empire West Title Agency | |
| Warranty Deed | $285,500 | Fidelity National Title Agen | |
| Warranty Deed | -- | None Available | |
| Interfamily Deed Transfer | -- | Lawyers Title Of Arizona Inc | |
| Cash Sale Deed | $177,000 | Lawyers Title Of Arizona Inc | |
| Trustee Deed | $257,580 | Great American Title Agency | |
| Warranty Deed | $334,000 | -- | |
| Interfamily Deed Transfer | -- | Capital Title Agency Inc | |
| Joint Tenancy Deed | $164,000 | Transnation Title Insurance | |
| Cash Sale Deed | $120,000 | Transnation Title Insurance |
| Date | Status | Loan Amount | Loan Type |
|---|---|---|---|
| Previous Owner | $279,920 | New Conventional | |
| Previous Owner | $285,500 | Seller Take Back | |
| Previous Owner | $267,200 | New Conventional | |
| Previous Owner | $175,500 | New Conventional | |
| Previous Owner | $147,600 | Seller Take Back | |
| Closed | $8,200 | No Value Available |
| Date | Event | Price | Change | Sq Ft Price |
|---|---|---|---|---|
| 04/01/2023 04/01/23 | Rented | $3,300 | 0.0% | -- |
| 02/09/2023 02/09/23 | Under Contract | -- | -- | -- |
| 01/23/2023 01/23/23 | Price Changed | $3,300 | -5.7% | $2 / Sq Ft |
| 01/16/2023 01/16/23 | For Rent | $3,500 | 0.0% | -- |
| 10/01/2021 10/01/21 | Rented | $3,500 | 0.0% | -- |
| 09/21/2021 09/21/21 | Under Contract | -- | -- | -- |
| 08/02/2021 08/02/21 | For Rent | $3,500 | 0.0% | -- |
| 07/30/2021 07/30/21 | Sold | $607,000 | -2.9% | $337 / Sq Ft |
| 07/23/2021 07/23/21 | Pending | -- | -- | -- |
| 07/15/2021 07/15/21 | Price Changed | $625,000 | -3.7% | $347 / Sq Ft |
| 06/23/2021 06/23/21 | Price Changed | $649,000 | -3.9% | $360 / Sq Ft |
| 06/09/2021 06/09/21 | For Sale | $675,000 | +92.9% | $375 / Sq Ft |
| 03/18/2016 03/18/16 | Sold | $349,900 | 0.0% | $176 / Sq Ft |
| 02/16/2016 02/16/16 | Pending | -- | -- | -- |
| 02/12/2016 02/12/16 | Pending | -- | -- | -- |
| 02/11/2016 02/11/16 | Price Changed | $349,900 | -5.4% | $176 / Sq Ft |
| 01/19/2016 01/19/16 | For Sale | $369,900 | 0.0% | $186 / Sq Ft |
| 03/01/2013 03/01/13 | Rented | $1,850 | -5.1% | -- |
| 02/07/2013 02/07/13 | Under Contract | -- | -- | -- |
| 12/18/2012 12/18/12 | For Rent | $1,950 | 0.0% | -- |
| 04/11/2012 04/11/12 | Sold | $177,000 | +1.2% | $98 / Sq Ft |
| 03/22/2012 03/22/12 | Pending | -- | -- | -- |
| 02/20/2012 02/20/12 | Price Changed | $174,900 | -7.9% | $97 / Sq Ft |
| 01/19/2012 01/19/12 | Price Changed | $189,900 | -7.8% | $105 / Sq Ft |
| 12/19/2011 12/19/11 | Price Changed | $205,900 | -8.4% | $114 / Sq Ft |
| 11/16/2011 11/16/11 | For Sale | $224,900 | -- | $125 / Sq Ft |
| Year | Tax Paid | Tax Assessment Tax Assessment Total Assessment is a certain percentage of the fair market value that is determined by local assessors to be the total taxable value of land and additions on the property. | Land | Improvement |
|---|---|---|---|---|
| 2025 | $3,744 | $29,952 | -- | -- |
| 2024 | $3,849 | $28,525 | -- | -- |
| 2023 | $3,849 | $50,610 | $10,120 | $40,490 |
| 2022 | $3,698 | $39,360 | $7,870 | $31,490 |
| 2021 | $3,376 | $37,320 | $7,460 | $29,860 |
| 2020 | $3,289 | $35,810 | $7,160 | $28,650 |
| 2019 | $3,270 | $30,510 | $6,100 | $24,410 |
| 2018 | $3,199 | $29,810 | $5,960 | $23,850 |
| 2017 | $3,068 | $27,880 | $5,570 | $22,310 |
| 2016 | $2,943 | $24,750 | $4,950 | $19,800 |
| 2015 | $3,090 | $22,530 | $4,500 | $18,030 |
Seller's Agent in 2023
Miki Nakajima
Russ Lyon Sotheby's International Realty
(928) 777-3225
7 in this area
40 Total Sales
Seller's Agent in 2021
Pamela Peacock
HomeSmart
(602) 505-0257
16 in this area
55 Total Sales
M
Buyer's Agent in 2021
Megan Smith
The Brokery
(661) 644-9287
4 in this area
39 Total Sales
R
Seller's Agent in 2016
Russell Black
Midland Real Estate Alliance
(480) 220-5131
2 in this area
6 Total Sales
Seller Co-Listing Agent in 2016
Bryan Schlueter
Midland Real Estate Alliance
(480) 620-9669
3 in this area
15 Total Sales
M
Buyer's Agent in 2016
Mike Fitzgerald
Fitzgerald Real Estate Company
Source: Arizona Regional Multiple Listing Service (ARMLS)
MLS Number: 4677809
APN: 170-30-014
Disclaimer: Certain information contained herein is derived from information provided by parties other than Homes.com. All information provided is deemed reliable, but is not guaranteed to be accurate and should be independently verified.
![]() All information should be verified by the recipient and none is guaranteed as accurate by ARMLS
All information should be verified by the recipient and none is guaranteed as accurate by ARMLS
Listing Information presented by local MLS brokerage: Ten-X, local REALTOR®- Arlene Richardson - (888)-952-6393