411 Chupcan Place Clayton, CA 94517
Estimated Value: $626,000 - $750,000
2
Beds
2
Baths
1,235
Sq Ft
$540/Sq Ft
Est. Value
About This Home
This home is located at 411 Chupcan Place, Clayton, CA 94517 and is currently estimated at $667,146, approximately $540 per square foot. 411 Chupcan Place is a home located in Contra Costa County with nearby schools including Mt. Diablo Elementary School, Diablo View Middle School, and College Park High School.
Ownership History
Date
Name
Owned For
Owner Type
Purchase Details
Closed on
Mar 23, 2022
Sold by
Shelton Michael T and Shelton Kazuko
Bought by
Shelton Revocable Trust
Current Estimated Value
Purchase Details
Closed on
Feb 17, 2016
Sold by
Harais Phyllis C
Bought by
Shelton Michael T and Shelton Kazuko
Home Financials for this Owner
Home Financials are based on the most recent Mortgage that was taken out on this home.
Original Mortgage
$255,000
Interest Rate
3.97%
Mortgage Type
New Conventional
Purchase Details
Closed on
Feb 28, 2003
Sold by
Harais Phyllis C
Bought by
Harais Phyllis C
Purchase Details
Closed on
Aug 23, 2002
Sold by
Rhinehart Jacqueline J
Bought by
Harais Phyllis C
Home Financials for this Owner
Home Financials are based on the most recent Mortgage that was taken out on this home.
Original Mortgage
$303,000
Interest Rate
6.52%
Mortgage Type
Stand Alone First
Purchase Details
Closed on
Aug 28, 2001
Sold by
Rhinehart Jacqueline Joan and Breeden Barbara L
Bought by
Rhinehart Jacqueline J
Create a Home Valuation Report for This Property
The Home Valuation Report is an in-depth analysis detailing your home's value as well as a comparison with similar homes in the area
Home Values in the Area
Average Home Value in this Area
Purchase History
| Date | Buyer | Sale Price | Title Company |
|---|---|---|---|
| Shelton Revocable Trust | -- | None Listed On Document | |
| Shelton Michael T | $500,000 | Old Republic Title Company | |
| Harais Phyllis C | -- | -- | |
| Harais Phyllis C | $380,000 | Financial Title Company | |
| Rhinehart Jacqueline J | -- | -- |
Source: Public Records
Mortgage History
| Date | Status | Borrower | Loan Amount |
|---|---|---|---|
| Previous Owner | Shelton Michael T | $255,000 | |
| Previous Owner | Harais Phyllis C | $303,000 |
Source: Public Records
Tax History
| Year | Tax Paid | Tax Assessment Tax Assessment Total Assessment is a certain percentage of the fair market value that is determined by local assessors to be the total taxable value of land and additions on the property. | Land | Improvement |
|---|---|---|---|---|
| 2025 | $7,931 | $591,892 | $331,459 | $260,433 |
| 2024 | $7,463 | $580,287 | $324,960 | $255,327 |
| 2023 | $7,463 | $568,910 | $318,589 | $250,321 |
| 2022 | $7,418 | $557,756 | $312,343 | $245,413 |
| 2021 | $7,280 | $546,820 | $306,219 | $240,601 |
| 2019 | $7,251 | $530,603 | $297,138 | $233,465 |
| 2018 | $6,988 | $520,200 | $291,312 | $228,888 |
| 2017 | $6,765 | $510,000 | $285,600 | $224,400 |
| 2016 | $2,068 | $89,908 | $32,316 | $57,592 |
| 2015 | $1,941 | $88,558 | $31,831 | $56,727 |
| 2014 | $1,877 | $86,824 | $31,208 | $55,616 |
Source: Public Records
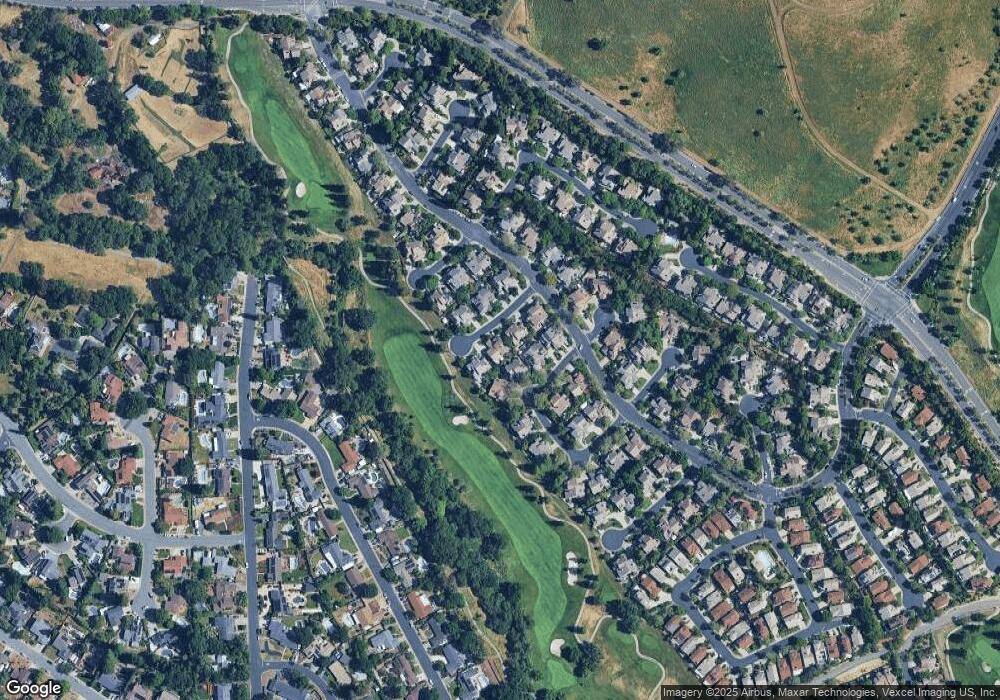
Map
Nearby Homes
- 402 Chupcan Place
- 5612 Frank Place
- 1273 Shell Cir
- 5581 Gonzalez Ct
- 1921 Eagle Peak Ave Unit 28
- 3038 Miwok Way
- 1833 Camino Estrada
- 5 Pardi Ln
- 1025 Panadero Way
- 5454 Anselmo Ct
- 249 Stranahan Cir
- 5555 Maryland Dr
- 5849 Mitchell Canyon Ct
- 314 Semillon Cir
- 1515 Ohara Ct
- 1199 Gamay Dr
- 5455 Kirkwood Dr Unit G3
- 1267 Quiet Cir
- 5565 Banff Ct
- 5515 Pennsylvania Blvd
- 409 Chupcan Place Unit 1
- 407 Chupcan Place
- 417 Chupcan Place
- 610 Julpun Loop
- 612 Julpun Loop
- 608 Julpun Loop
- 405 Chupcan Place
- 606 Julpun Loop
- 614 Julpun Loop
- 410 Chupcan Place
- 408 Chupcan Place
- 406 Chupcan Place
- 403 Chupcan Place
- 404 Chupcan Place Unit 1
- 602 Julpun Loop
- 401 Chupcan Place
- 600 Julpun Loop
- 49 Tule Ct
- 51 Tule Ct
- 616 Julpun Loop
Your Personal Tour Guide
Ask me questions while you tour the home.