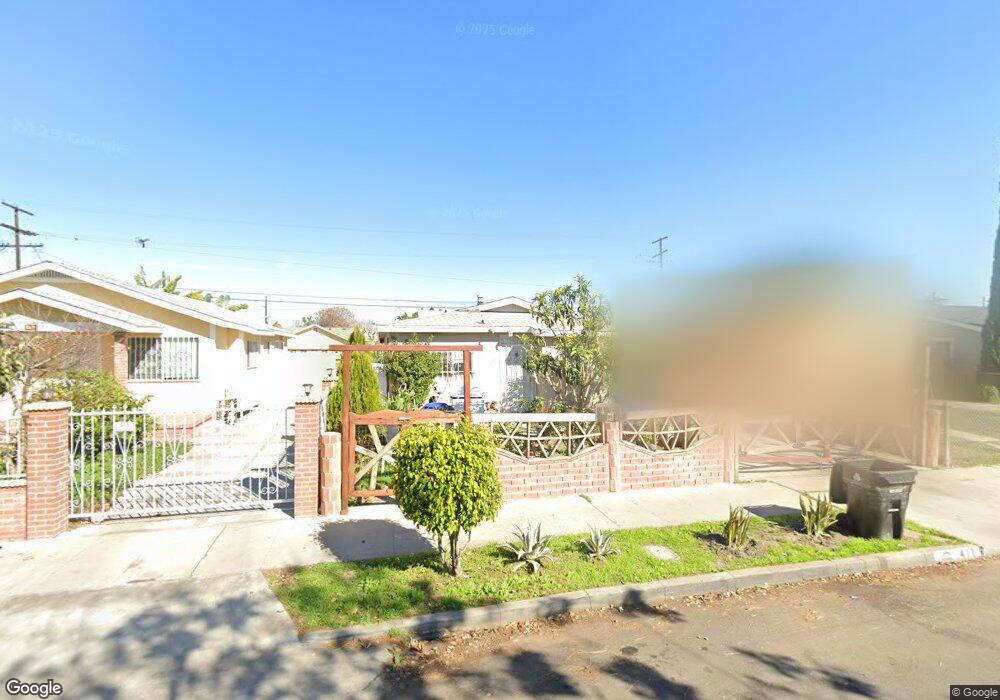
411 E 71st St Unit 2 Los Angeles, CA 90003
Florence NeighborhoodEstimated Value: $630,747 - $840,000
3
Beds
1
Bath
400
Sq Ft
$1,743/Sq Ft
Est. Value
About This Home
This home is located at 411 E 71st St Unit 2, Los Angeles, CA 90003 and is currently estimated at $697,187, approximately $1,742 per square foot. 411 E 71st St Unit 2 is a home located in Los Angeles County with nearby schools including Sixty-Sixth Street Elementary School, Mary McLeod Bethune Middle School, and Academy For Multiligual Arts And Science At Mervyn M. Dymally High.
Ownership History
Date
Name
Owned For
Owner Type
Purchase Details
Closed on
Apr 7, 2014
Sold by
Tan Joanne S
Bought by
Ordaz Joel
Current Estimated Value
Home Financials for this Owner
Home Financials are based on the most recent Mortgage that was taken out on this home.
Original Mortgage
$294,566
Outstanding Balance
$227,332
Interest Rate
4.75%
Mortgage Type
FHA
Estimated Equity
$469,855
Purchase Details
Closed on
Jun 14, 2013
Sold by
Boyd Kozet P
Bought by
Tan Joanne S
Home Financials for this Owner
Home Financials are based on the most recent Mortgage that was taken out on this home.
Original Mortgage
$157,500
Interest Rate
3.32%
Mortgage Type
New Conventional
Purchase Details
Closed on
Sep 11, 1997
Sold by
Boyd Kozet P
Bought by
Boyd Kozet P
Home Financials for this Owner
Home Financials are based on the most recent Mortgage that was taken out on this home.
Original Mortgage
$40,000
Interest Rate
7.54%
Create a Home Valuation Report for This Property
The Home Valuation Report is an in-depth analysis detailing your home's value as well as a comparison with similar homes in the area
Home Values in the Area
Average Home Value in this Area
Purchase History
| Date | Buyer | Sale Price | Title Company |
|---|---|---|---|
| Ordaz Joel | $300,000 | Pacific Coast Title Co | |
| Tan Joanne S | $210,000 | Fidelity National Title Co | |
| Boyd Kozet P | -- | American Title Ins Co |
Source: Public Records
Mortgage History
| Date | Status | Borrower | Loan Amount |
|---|---|---|---|
| Open | Ordaz Joel | $294,566 | |
| Previous Owner | Tan Joanne S | $157,500 | |
| Previous Owner | Boyd Kozet P | $40,000 |
Source: Public Records
Tax History Compared to Growth
Tax History
| Year | Tax Paid | Tax Assessment Tax Assessment Total Assessment is a certain percentage of the fair market value that is determined by local assessors to be the total taxable value of land and additions on the property. | Land | Improvement |
|---|---|---|---|---|
| 2025 | $4,581 | $367,749 | $259,388 | $108,361 |
| 2024 | $4,581 | $360,539 | $254,302 | $106,237 |
| 2023 | $4,495 | $353,470 | $249,316 | $104,154 |
| 2022 | $4,289 | $346,540 | $244,428 | $102,112 |
| 2021 | $4,233 | $339,746 | $239,636 | $100,110 |
| 2020 | $4,273 | $336,263 | $237,179 | $99,084 |
| 2019 | $4,109 | $329,671 | $232,529 | $97,142 |
| 2018 | $4,059 | $323,208 | $227,970 | $95,238 |
| 2016 | $3,873 | $310,659 | $219,118 | $91,541 |
| 2015 | $3,818 | $305,993 | $215,827 | $90,166 |
| 2014 | $2,756 | $210,953 | $150,681 | $60,272 |
Source: Public Records
Map
Nearby Homes
- 433 E 74th St
- 505 E 68th St
- 633 E 73rd St
- 329 E 68th St
- 710 E Florence Ave
- 243 E 68th St
- 652 E 74th St
- 215 E 73rd St
- 6617 S San Pedro St
- 6611 S San Pedro St
- 751 E 73rd St
- 151 E 69th St
- 421 E 65th St
- 500 E 64th St
- 151 E 67th St
- 124 E 74th St
- 628 E 76th Place
- 134 E 75th St
- 7402 Avalon Blvd
- 7675 S San Pedro St