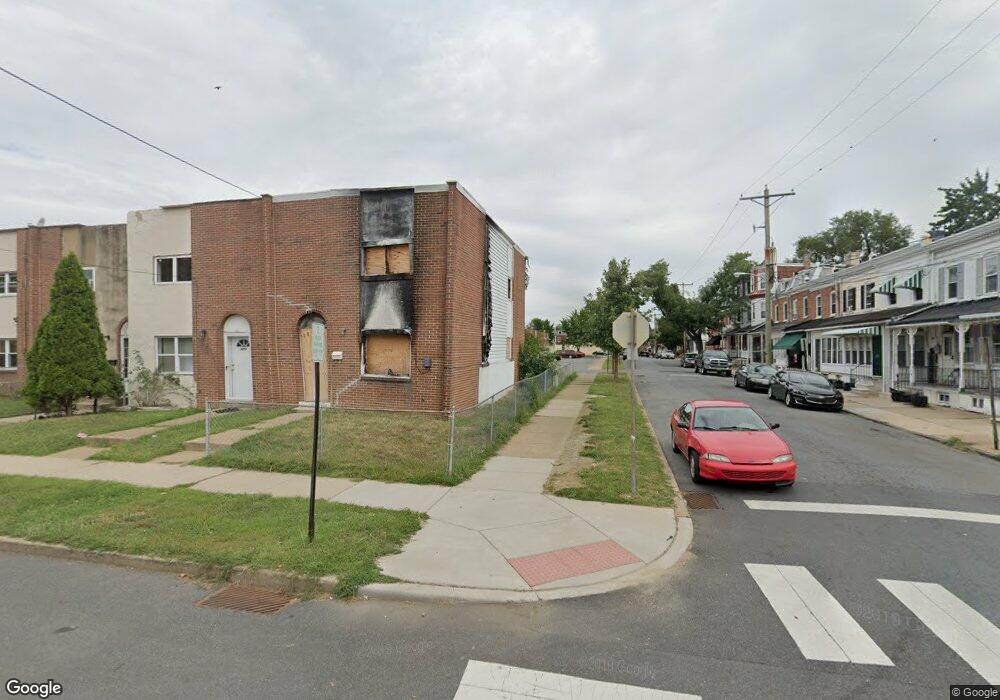
411 E 8th St Wilmington, DE 19801
Downtown Wilmington NeighborhoodEstimated Value: $157,188 - $217,000
3
Beds
1
Bath
1,300
Sq Ft
$138/Sq Ft
Est. Value
About This Home
This home is located at 411 E 8th St, Wilmington, DE 19801 and is currently estimated at $179,047, approximately $137 per square foot. 411 E 8th St is a home located in New Castle County with nearby schools including The Bancroft School, The Bayard School, and Newark High School.
Ownership History
Date
Name
Owned For
Owner Type
Purchase Details
Closed on
Jul 17, 2024
Sold by
Wilmington Neighborhood Conservancy Land
Bought by
City Of Wilmington
Current Estimated Value
Purchase Details
Closed on
Oct 9, 2023
Sold by
Inter-Neighborhood Community Builders Ll
Bought by
Wilmington Neighborhood Conservancy Land Bank
Purchase Details
Closed on
Apr 16, 2020
Sold by
Wilmington Neighborhood Conservancy Land
Bought by
Inter Neighborhood Cmnty Builders Llc
Purchase Details
Closed on
Mar 15, 2019
Sold by
One Pie Holdings Llc
Bought by
Wilmington Neighborhood Conservatory Lan
Purchase Details
Closed on
Apr 12, 2012
Sold by
Preston Mary D and City Of Wilmington
Bought by
One Pie Holdings Llc
Create a Home Valuation Report for This Property
The Home Valuation Report is an in-depth analysis detailing your home's value as well as a comparison with similar homes in the area
Home Values in the Area
Average Home Value in this Area
Purchase History
| Date | Buyer | Sale Price | Title Company |
|---|---|---|---|
| City Of Wilmington | -- | None Listed On Document | |
| Wilmington Neighborhood Conservancy Land Bank | -- | None Listed On Document | |
| Inter Neighborhood Cmnty Builders Llc | -- | None Available | |
| Wilmington Neighborhood Conservatory Lan | -- | None Available | |
| One Pie Holdings Llc | $3,022 | None Available |
Source: Public Records
Tax History
| Year | Tax Paid | Tax Assessment Tax Assessment Total Assessment is a certain percentage of the fair market value that is determined by local assessors to be the total taxable value of land and additions on the property. | Land | Improvement |
|---|---|---|---|---|
| 2024 | -- | $28,700 | $2,800 | $25,900 |
| 2023 | $532 | $28,700 | $2,800 | $25,900 |
| 2022 | $21 | $28,700 | $2,800 | $25,900 |
| 2021 | $19 | $28,700 | $2,800 | $25,900 |
| 2020 | $966 | $28,700 | $2,800 | $25,900 |
| 2019 | $840 | $28,700 | $2,800 | $25,900 |
| 2018 | $678 | $28,700 | $2,800 | $25,900 |
| 2017 | $1,331 | $28,700 | $2,800 | $25,900 |
| 2016 | $1,331 | $28,700 | $2,800 | $25,900 |
| 2015 | $1,247 | $28,700 | $2,800 | $25,900 |
| 2014 | $1,246 | $28,700 | $2,800 | $25,900 |
Source: Public Records
Map
Nearby Homes
- 508 Taylor St
- 524 Taylor St
- 912 N Lombard St
- 914 N Lombard St
- 321 E 9th St
- 903 Kirkwood St
- 932 Clifford Brown Walk
- 409 E 10th St
- 1016 Clifford Brown Walk
- 841 Bennett St
- 1013 N Pine St
- 847 Bennett St
- 849 Bennett St
- 1017 N Pine St
- 836 Bennett St
- 850 Bennett St
- 701 E 6th St
- DUPLEX ON E 11th St
- 936 N Spruce St
- 1 W Mccaulley Ct
- 409 E 8th St
- 407 E 8th St
- 405 E 8th St
- 403 E 8th St
- 801 N Lombard St
- 401 E 8th St
- 806 N Lombard St
- 804 N Lombard St
- 803 N Lombard St
- 808 N Lombard St
- 802 N Lombard St
- 810 N Lombard St
- 812 N Lombard St
- 805 N Lombard St
- 814 N Lombard St
- 816 N Lombard St
- 807 N Lombard St
- 503 E 8th St
- 818 N Lombard St
- 809 N Lombard St
Your Personal Tour Guide
Ask me questions while you tour the home.