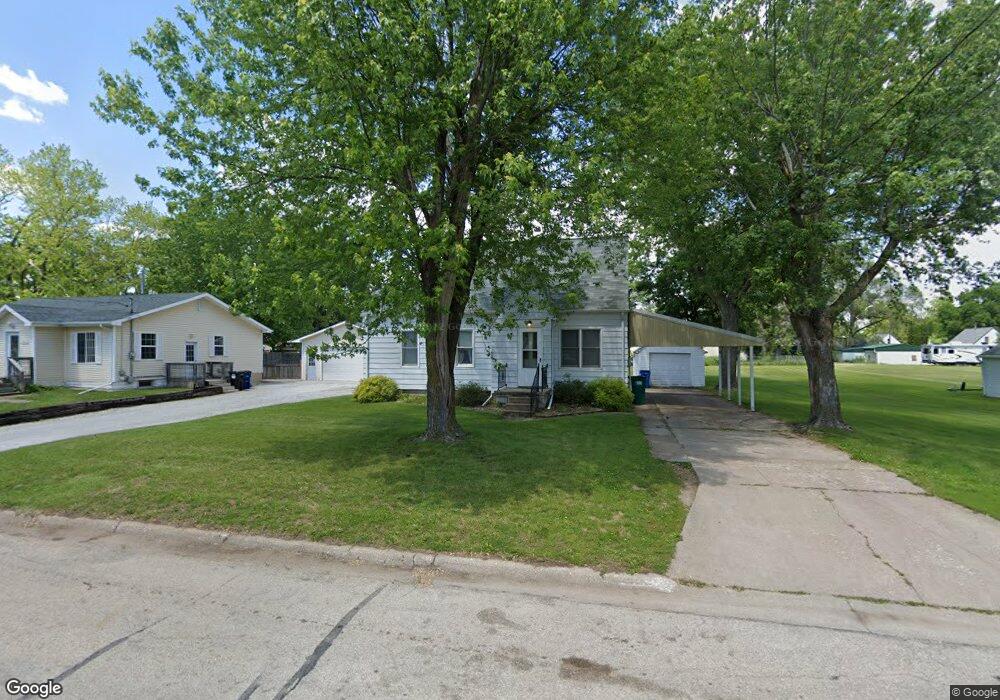
411 E End Ave Evansdale, IA 50707
Estimated Value: $126,350 - $137,000
2
Beds
2
Baths
956
Sq Ft
$137/Sq Ft
Est. Value
About This Home
This home is located at 411 E End Ave, Evansdale, IA 50707 and is currently estimated at $131,088, approximately $137 per square foot. 411 E End Ave is a home located in Black Hawk County with nearby schools including Poyner Elementary School, Bunger Middle School, and East High School.
Ownership History
Date
Name
Owned For
Owner Type
Purchase Details
Closed on
Mar 20, 2017
Sold by
Joseph D Kruth
Bought by
Folkers Cory
Current Estimated Value
Home Financials for this Owner
Home Financials are based on the most recent Mortgage that was taken out on this home.
Original Mortgage
$60,000
Outstanding Balance
$49,934
Interest Rate
4.3%
Estimated Equity
$81,154
Purchase Details
Closed on
Nov 12, 2014
Sold by
Kruth Leo J and Kruth Marlene M
Bought by
Kruth Marlene M
Create a Home Valuation Report for This Property
The Home Valuation Report is an in-depth analysis detailing your home's value as well as a comparison with similar homes in the area
Home Values in the Area
Average Home Value in this Area
Purchase History
| Date | Buyer | Sale Price | Title Company |
|---|---|---|---|
| Folkers Cory | -- | -- | |
| Kruth Marlene M | -- | None Available |
Source: Public Records
Mortgage History
| Date | Status | Borrower | Loan Amount |
|---|---|---|---|
| Open | Folkers Cory | $60,000 | |
| Closed | Folkers Cory | -- |
Source: Public Records
Tax History Compared to Growth
Tax History
| Year | Tax Paid | Tax Assessment Tax Assessment Total Assessment is a certain percentage of the fair market value that is determined by local assessors to be the total taxable value of land and additions on the property. | Land | Improvement |
|---|---|---|---|---|
| 2024 | $1,506 | $99,530 | $14,850 | $84,680 |
| 2023 | $1,190 | $99,530 | $14,850 | $84,680 |
| 2022 | $1,182 | $76,620 | $14,850 | $61,770 |
| 2021 | $1,170 | $76,620 | $14,850 | $61,770 |
| 2020 | $1,162 | $70,400 | $11,880 | $58,520 |
| 2019 | $1,162 | $70,400 | $11,880 | $58,520 |
| 2018 | $1,204 | $70,410 | $11,880 | $58,530 |
| 2017 | $1,012 | $70,410 | $11,880 | $58,530 |
| 2016 | $994 | $70,410 | $11,880 | $58,530 |
| 2015 | $994 | $70,410 | $11,880 | $58,530 |
| 2014 | $942 | $67,000 | $11,880 | $55,120 |
Source: Public Records
Map
Nearby Homes