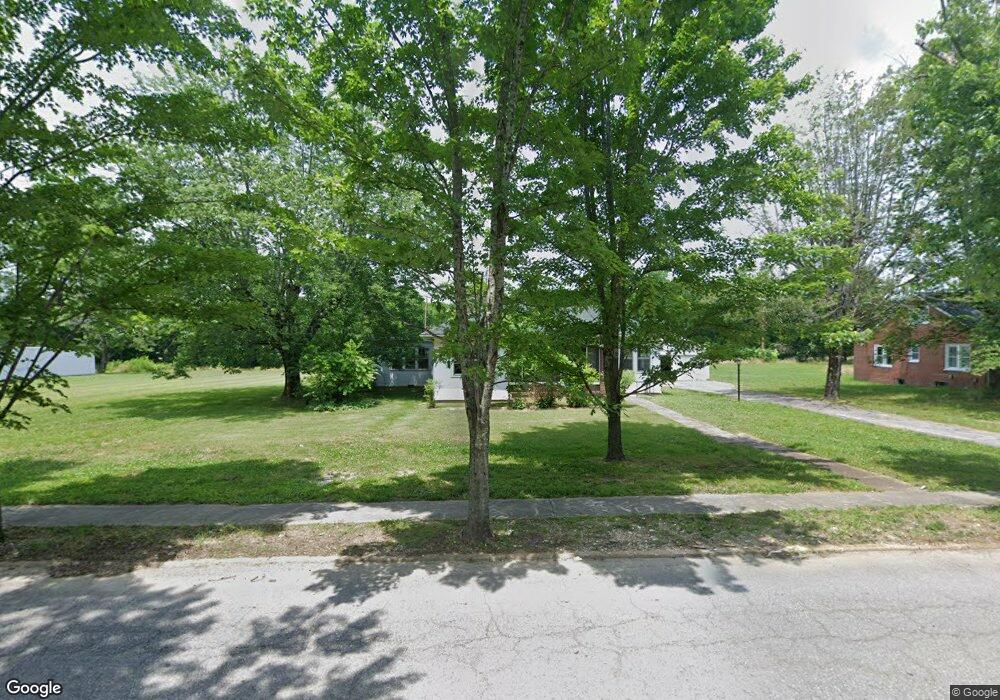
411 E Main St Waverly, TN 37185
Estimated Value: $158,000 - $213,000
Studio
2
Baths
1,816
Sq Ft
$97/Sq Ft
Est. Value
About This Home
This home is located at 411 E Main St, Waverly, TN 37185 and is currently estimated at $176,993, approximately $97 per square foot. 411 E Main St is a home located in Humphreys County.
Ownership History
Date
Name
Owned For
Owner Type
Purchase Details
Closed on
Oct 3, 2019
Sold by
Pace Ronald D
Bought by
Pace Derek M
Current Estimated Value
Purchase Details
Closed on
Oct 30, 2012
Sold by
Cavender Catherine C
Bought by
Pace Ronald D
Home Financials for this Owner
Home Financials are based on the most recent Mortgage that was taken out on this home.
Original Mortgage
$72,000
Interest Rate
3.4%
Mortgage Type
Cash
Purchase Details
Closed on
Aug 15, 1985
Bought by
Cavender Gray A and Cavender Catherine C
Purchase Details
Closed on
Dec 6, 1938
Create a Home Valuation Report for This Property
The Home Valuation Report is an in-depth analysis detailing your home's value as well as a comparison with similar homes in the area
Home Values in the Area
Average Home Value in this Area
Purchase History
| Date | Buyer | Sale Price | Title Company |
|---|---|---|---|
| Pace Derek M | -- | None Available | |
| Pace Ronald D | $72,000 | -- | |
| Cavender Gray A | -- | -- | |
| -- | -- | -- |
Source: Public Records
Mortgage History
| Date | Status | Borrower | Loan Amount |
|---|---|---|---|
| Closed | Pace Ronald D | $72,000 |
Source: Public Records
Tax History
| Year | Tax Paid | Tax Assessment Tax Assessment Total Assessment is a certain percentage of the fair market value that is determined by local assessors to be the total taxable value of land and additions on the property. | Land | Improvement |
|---|---|---|---|---|
| 2025 | $518 | $17,050 | $9,100 | $7,950 |
| 2024 | $519 | $17,050 | $9,100 | $7,950 |
| 2023 | $520 | $17,050 | $9,100 | $7,950 |
| 2022 | $482 | $15,025 | $9,175 | $5,850 |
| 2021 | $843 | $15,025 | $9,175 | $5,850 |
| 2020 | $1,046 | $32,600 | $9,175 | $23,425 |
| 2019 | $917 | $27,850 | $9,100 | $18,750 |
| 2018 | $917 | $27,850 | $9,100 | $18,750 |
| 2017 | $917 | $27,850 | $9,100 | $18,750 |
| 2016 | $798 | $22,425 | $9,100 | $13,325 |
| 2015 | $798 | $22,425 | $9,100 | $13,325 |
| 2014 | $798 | $22,411 | $0 | $0 |
Source: Public Records
Map
Nearby Homes
- 104 Fairground Dr
- 101 Simpson Ave
- 116 Fairground Dr
- 424 E Commerce St
- 206 Joe St
- 209 Armstrong St
- 120 Joe St
- 311 E Main St
- 202 Pine Hill Dr
- 102 N Cooley Ave
- 207 Sycamore Ave
- 128 Washington Cir
- 0 Old Skyline Dr Unit RTC3015061
- 105 Hillwood Dr
- 805 E Railroad St
- 0 Bear Hollow Dr Unit 120
- 0 Bear Hollow Dr Unit RTC2747935
- 202 E Richland Ave
- 114 Sutton Ave
- 375 Highway 13 N
Your Personal Tour Guide
Ask me questions while you tour the home.