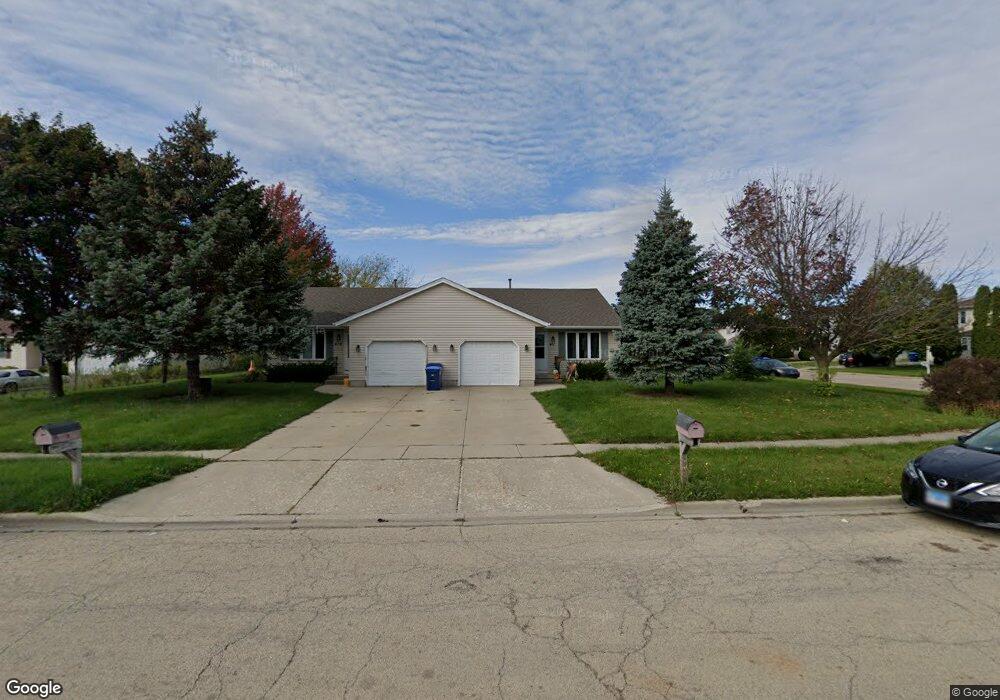
411 Jasmine St Unit 1 Dekalb, IL 60115
Estimated Value: $177,000 - $283,000
4
Beds
2
Baths
952
Sq Ft
$225/Sq Ft
Est. Value
About This Home
This home is located at 411 Jasmine St Unit 1, Dekalb, IL 60115 and is currently estimated at $213,864, approximately $224 per square foot. 411 Jasmine St Unit 1 is a home located in DeKalb County with nearby schools including Founders Elementary School, Huntley Middle School, and De Kalb High School.
Ownership History
Date
Name
Owned For
Owner Type
Purchase Details
Closed on
May 25, 2017
Sold by
Cantero Cindy
Bought by
Bartel Christopher and Bartel Cathy
Current Estimated Value
Home Financials for this Owner
Home Financials are based on the most recent Mortgage that was taken out on this home.
Original Mortgage
$72,800
Interest Rate
3.96%
Mortgage Type
New Conventional
Purchase Details
Closed on
Mar 31, 2017
Sold by
Bartel Paula A and Kooy Michael
Bought by
Wright Kyle
Home Financials for this Owner
Home Financials are based on the most recent Mortgage that was taken out on this home.
Original Mortgage
$72,800
Interest Rate
3.96%
Mortgage Type
New Conventional
Purchase Details
Closed on
May 20, 2005
Sold by
Vaughn Robert L
Bought by
Bartel Paul A and Bartel Christopher A
Home Financials for this Owner
Home Financials are based on the most recent Mortgage that was taken out on this home.
Original Mortgage
$90,500
Interest Rate
6.05%
Mortgage Type
New Conventional
Create a Home Valuation Report for This Property
The Home Valuation Report is an in-depth analysis detailing your home's value as well as a comparison with similar homes in the area
Home Values in the Area
Average Home Value in this Area
Purchase History
| Date | Buyer | Sale Price | Title Company |
|---|---|---|---|
| Bartel Christopher | -- | Attorney | |
| Wright Kyle | $91,000 | Attorney | |
| Bartel Paul A | $146,500 | -- |
Source: Public Records
Mortgage History
| Date | Status | Borrower | Loan Amount |
|---|---|---|---|
| Previous Owner | Wright Kyle | $72,800 | |
| Previous Owner | Bartel Paul A | $90,500 |
Source: Public Records
Tax History Compared to Growth
Tax History
| Year | Tax Paid | Tax Assessment Tax Assessment Total Assessment is a certain percentage of the fair market value that is determined by local assessors to be the total taxable value of land and additions on the property. | Land | Improvement |
|---|---|---|---|---|
| 2024 | $3,960 | $48,138 | $5,960 | $42,178 |
| 2023 | $3,960 | $41,973 | $5,197 | $36,776 |
| 2022 | $3,882 | $38,321 | $5,931 | $32,390 |
| 2021 | $3,986 | $35,942 | $5,563 | $30,379 |
| 2020 | $4,076 | $35,369 | $5,474 | $29,895 |
| 2019 | $3,997 | $33,979 | $5,259 | $28,720 |
| 2018 | $3,903 | $32,827 | $5,081 | $27,746 |
| 2017 | $3,940 | $31,555 | $4,884 | $26,671 |
| 2016 | $3,896 | $30,759 | $4,761 | $25,998 |
| 2015 | -- | $29,144 | $4,511 | $24,633 |
| 2014 | -- | $29,519 | $6,527 | $22,992 |
| 2013 | -- | $31,007 | $6,856 | $24,151 |
Source: Public Records
Map
Nearby Homes
- 1548 Moluf St
- 1289 Ivy St
- 664 Magnolia St
- 451 Thresher St
- 476 Thresher St
- 685 Persimmon St
- 1563 Farmstead Ln
- 643 Plum St
- 1692 Furrow St
- 1663 Furrow St
- 399 Bantam St
- 1723 Goldenrod Turn
- 1734 Sunglow Ln
- 910 Dawn Ct
- 1143 Quail Run
- 1133 Golf Ct
- 1177 Golf Ct
- 752 Kensington Blvd
- 1206 University Dr
- 468 Bush St