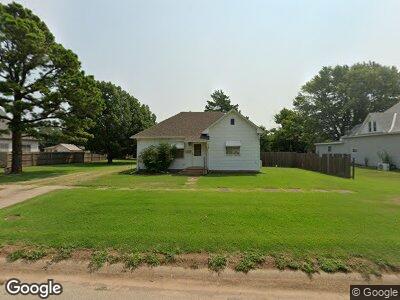
411 S Franklin Ave Anthony, KS 67003
Estimated Value: $50,000 - $62,000
2
Beds
1
Bath
1,176
Sq Ft
$49/Sq Ft
Est. Value
About This Home
This home is located at 411 S Franklin Ave, Anthony, KS 67003 and is currently estimated at $57,869, approximately $49 per square foot. 411 S Franklin Ave is a home located in Harper County with nearby schools including Chaparral Jr/Sr High School.
Ownership History
Date
Name
Owned For
Owner Type
Purchase Details
Closed on
Jun 1, 1999
Bought by
Connelly Sue C and Connelly Robert E
Current Estimated Value
Create a Home Valuation Report for This Property
The Home Valuation Report is an in-depth analysis detailing your home's value as well as a comparison with similar homes in the area
Home Values in the Area
Average Home Value in this Area
Purchase History
| Date | Buyer | Sale Price | Title Company |
|---|---|---|---|
| Connelly Sue C | $8,751 | -- |
Source: Public Records
Tax History Compared to Growth
Tax History
| Year | Tax Paid | Tax Assessment Tax Assessment Total Assessment is a certain percentage of the fair market value that is determined by local assessors to be the total taxable value of land and additions on the property. | Land | Improvement |
|---|---|---|---|---|
| 2024 | $7 | $3,782 | $1,070 | $2,712 |
| 2023 | $602 | $3,266 | $1,010 | $2,256 |
| 2022 | $455 | $2,859 | $968 | $1,891 |
| 2021 | $455 | $2,300 | $744 | $1,556 |
| 2020 | $455 | $2,300 | $649 | $1,651 |
| 2019 | $655 | $3,156 | $729 | $2,427 |
| 2018 | $679 | $3,322 | $925 | $2,397 |
| 2017 | $775 | $3,823 | $925 | $2,898 |
| 2016 | $778 | $3,823 | $804 | $3,019 |
| 2015 | -- | $3,851 | $753 | $3,098 |
| 2014 | -- | $4,014 | $472 | $3,542 |
Source: Public Records
Map
Nearby Homes
- 402 S Madison Ave
- 431 S Lincoln Ave
- 113 S Jefferson Ave
- 2 Crown Cir
- 119 N Jennings Ave
- 323 N Springfield Ave
- 506 S Kansas Ave
- 302 S Kansas Ave
- 303 N Bluff Ave
- 323 N Bluff Ave
- 604 N Lincoln Ave
- 610 N Anthony Ave
- 525 N Pennsylvania Ave
- 812 N Springfield Ave
- 622 N Pennsylvania Ave
- 324 N Ll and G Ave
- 1014 N Anthony Ave
- 2 E Cattail Cove Cir
- 00000 NW 10 Ave
- 462 SE 40 Ave
- 411 S Franklin Ave
- 401 S Franklin Ave
- 415 S Franklin Ave
- 406 S Madison Ave
- 323 S Franklin Ave
- 402 S Franklin Ave
- 418 S Franklin Ave
- 324 S Madison Ave
- 408 S Franklin Ave
- 315 S Franklin Ave
- 324 S Franklin Ave
- 435 S Franklin Ave
- 316 S Franklin Ave
- 316 S Madison Ave
- 424 S Franklin Ave
- 401 S Madison Ave
- 411 S Lincoln Ave
- 401 S Lincoln Ave
- 415 S Lincoln Ave
- 303 S Franklin Ave