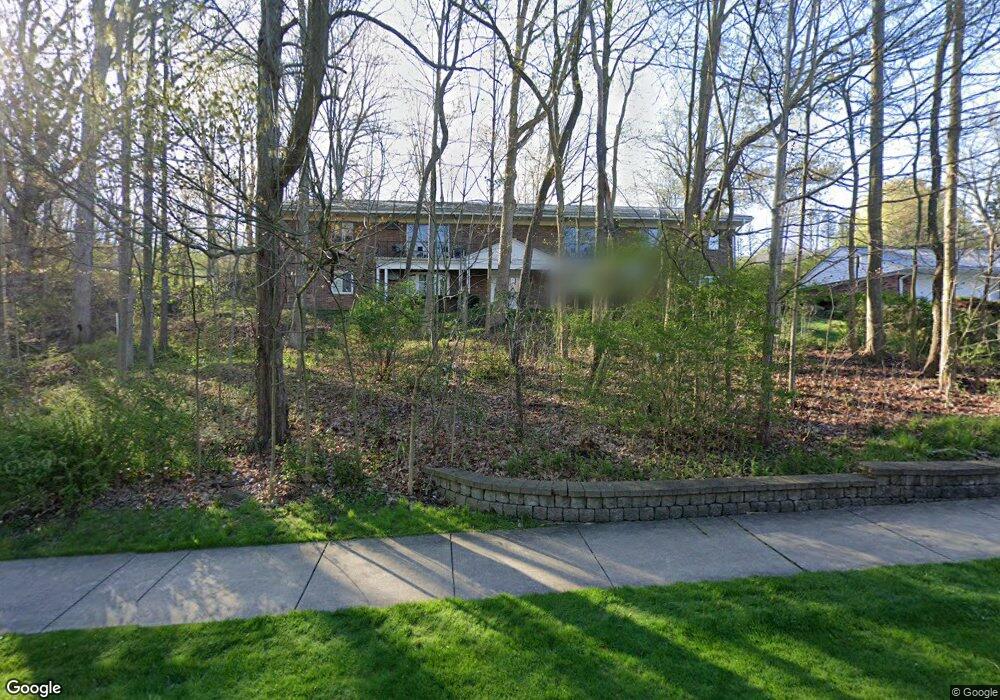
411 Solon Rd Unit 2A Chagrin Falls, OH 44022
Estimated Value: $106,393 - $275,000
2
Beds
1
Bath
722
Sq Ft
$264/Sq Ft
Est. Value
About This Home
This home is located at 411 Solon Rd Unit 2A, Chagrin Falls, OH 44022 and is currently estimated at $190,697, approximately $264 per square foot. 411 Solon Rd Unit 2A is a home located in Cuyahoga County with nearby schools including Gurney Elementary School, Chagrin Falls Intermediate Elementary School, and Chagrin Falls Middle School.
Ownership History
Date
Name
Owned For
Owner Type
Purchase Details
Closed on
Jan 19, 2021
Sold by
Christian Sarah and Christian Padraic
Bought by
Christian Barbara J
Current Estimated Value
Purchase Details
Closed on
Mar 22, 2019
Sold by
Smith Allison Vinciquerra and Smith Jonathan Zachary
Bought by
Christian Sarah and Cassidy Padraic
Purchase Details
Closed on
Aug 1, 2008
Sold by
Koreness Gregory B
Bought by
Vinciquerra Allison
Home Financials for this Owner
Home Financials are based on the most recent Mortgage that was taken out on this home.
Original Mortgage
$60,000
Interest Rate
6.5%
Mortgage Type
Purchase Money Mortgage
Purchase Details
Closed on
Jun 18, 2002
Sold by
Mcbride Charles and Mcbride Kristen W
Bought by
Koreness Gregory B
Home Financials for this Owner
Home Financials are based on the most recent Mortgage that was taken out on this home.
Original Mortgage
$68,000
Interest Rate
6.87%
Purchase Details
Closed on
Oct 12, 2000
Sold by
Halpin Nancy
Bought by
Mcbride Charles and Wendel Kristen
Home Financials for this Owner
Home Financials are based on the most recent Mortgage that was taken out on this home.
Original Mortgage
$60,300
Interest Rate
8.03%
Purchase Details
Closed on
Dec 15, 1998
Sold by
Halpin Nancy C
Bought by
Halpin Thomas C
Purchase Details
Closed on
Aug 24, 1998
Sold by
Strobel Ben E
Bought by
Halpin Nancy C
Home Financials for this Owner
Home Financials are based on the most recent Mortgage that was taken out on this home.
Original Mortgage
$50,000
Interest Rate
7.04%
Purchase Details
Closed on
Jun 25, 1998
Sold by
Strobel Ben E and Strobel Marsha Scott
Bought by
Strobel Ben E
Home Financials for this Owner
Home Financials are based on the most recent Mortgage that was taken out on this home.
Original Mortgage
$50,000
Interest Rate
7.04%
Purchase Details
Closed on
Nov 20, 1996
Sold by
Celano Mary A
Bought by
Strobel Ben E and Strobel Marsha S
Purchase Details
Closed on
Mar 31, 1995
Sold by
Moore Joyce A
Bought by
Celano Mary A
Purchase Details
Closed on
Jul 8, 1985
Sold by
Lomas Bernard T
Bought by
Moore Joyce A
Purchase Details
Closed on
Aug 15, 1979
Bought by
Lomas Bernard T
Purchase Details
Closed on
Oct 14, 1975
Bought by
Chagrin Falls Investment Ltd
Purchase Details
Closed on
Jul 22, 1975
Sold by
Condo Conversions
Bought by
Fedor Dennis G Tr
Purchase Details
Closed on
Jan 1, 1975
Bought by
Condo Conversions
Create a Home Valuation Report for This Property
The Home Valuation Report is an in-depth analysis detailing your home's value as well as a comparison with similar homes in the area
Home Values in the Area
Average Home Value in this Area
Purchase History
| Date | Buyer | Sale Price | Title Company |
|---|---|---|---|
| Christian Barbara J | -- | None Listed On Document | |
| Christian Sarah | $69,000 | New Republic Title Agency | |
| Vinciquerra Allison | $85,000 | Ohio Real Title | |
| Koreness Gregory B | $88,000 | Chicago Title Insurance Comp | |
| Mcbride Charles | $71,000 | Title Xperts Agency Inc | |
| Halpin Thomas C | -- | Chicago Title | |
| Halpin Nancy C | $63,500 | -- | |
| Strobel Ben E | -- | Chicago Title Insurance Comp | |
| Strobel Ben E | $64,600 | -- | |
| Celano Mary A | $50,000 | -- | |
| Moore Joyce A | $29,500 | -- | |
| Lomas Bernard T | $36,000 | -- | |
| Chagrin Falls Investment Ltd | $20,200 | -- | |
| Condominium Conversions | -- | -- | |
| Fedor Dennis G Tr | -- | -- | |
| Condo Conversions | -- | -- |
Source: Public Records
Mortgage History
| Date | Status | Borrower | Loan Amount |
|---|---|---|---|
| Previous Owner | Vinciquerra Allison | $60,000 | |
| Previous Owner | Koreness Gregory B | $68,000 | |
| Previous Owner | Mcbride Charles | $60,300 | |
| Previous Owner | Halpin Nancy C | $50,000 |
Source: Public Records
Tax History
| Year | Tax Paid | Tax Assessment Tax Assessment Total Assessment is a certain percentage of the fair market value that is determined by local assessors to be the total taxable value of land and additions on the property. | Land | Improvement |
|---|---|---|---|---|
| 2025 | $1,152 | $29,050 | $3,500 | $25,550 |
| 2024 | $1,187 | $29,050 | $3,500 | $25,550 |
| 2023 | $1,066 | $24,150 | $2,170 | $21,980 |
| 2022 | $1,159 | $24,150 | $2,170 | $21,980 |
| 2021 | $1,810 | $24,150 | $2,170 | $21,980 |
| 2020 | $1,504 | $18,520 | $1,860 | $16,660 |
| 2019 | $1,481 | $52,900 | $5,300 | $47,600 |
| 2018 | $1,473 | $18,520 | $1,860 | $16,660 |
| 2017 | $1,816 | $21,600 | $2,170 | $19,430 |
| 2016 | $1,630 | $21,600 | $2,170 | $19,430 |
| 2015 | $1,633 | $21,600 | $2,170 | $19,430 |
| 2014 | $2,073 | $26,990 | $2,700 | $24,290 |
Source: Public Records
Map
Nearby Homes
- 145 Greenbrier Dr
- 315 Solon Rd Unit 309
- 318 Hillside Ln
- 81 Hall St
- 65 Quail Ridge Dr
- 106 Solon Rd
- 16690 Dayton St
- S/L Rocker Ave
- 6331 Chagrin River Rd
- 225 S Main St
- 26 Water St
- 7202 Woodland Ave
- 219 S Main St
- 213 S Main St
- 207 S Main St
- 40 Highland Ln
- 16788 Geneva St
- 106 W Washington St
- 35 Skyline Dr
- 110 Emilia Ct
- 411 Solon Rd Unit 6A
- 411 Solon Rd Unit 3A
- 411 Solon Rd Unit 8A
- 411 Solon Rd Unit 4A
- 411 Solon Rd Unit 1A
- 411 Solon Rd
- 411 Solon Rd Unit 5A
- 411 Solon Rd Unit A4
- 5009 Nob Hill Dr Unit B3
- 5009 Nob Hill Dr Unit B7
- 5011 Nob Hill Dr Unit 13C
- 5009 Nob Hill Dr Unit B4
- 5011 Nob Hill Dr Unit 9C
- 5011 Nob Hill Dr Unit 12C
- 5009 Nob Hill Dr Unit B8
- 5011 Nob Hill Dr Unit 16C
- 5009 Nob Hill Dr
- 5009 Nob Hill Dr
- 5011 Nob Hill Dr
- 5011 Nob Hill Dr
Your Personal Tour Guide
Ask me questions while you tour the home.