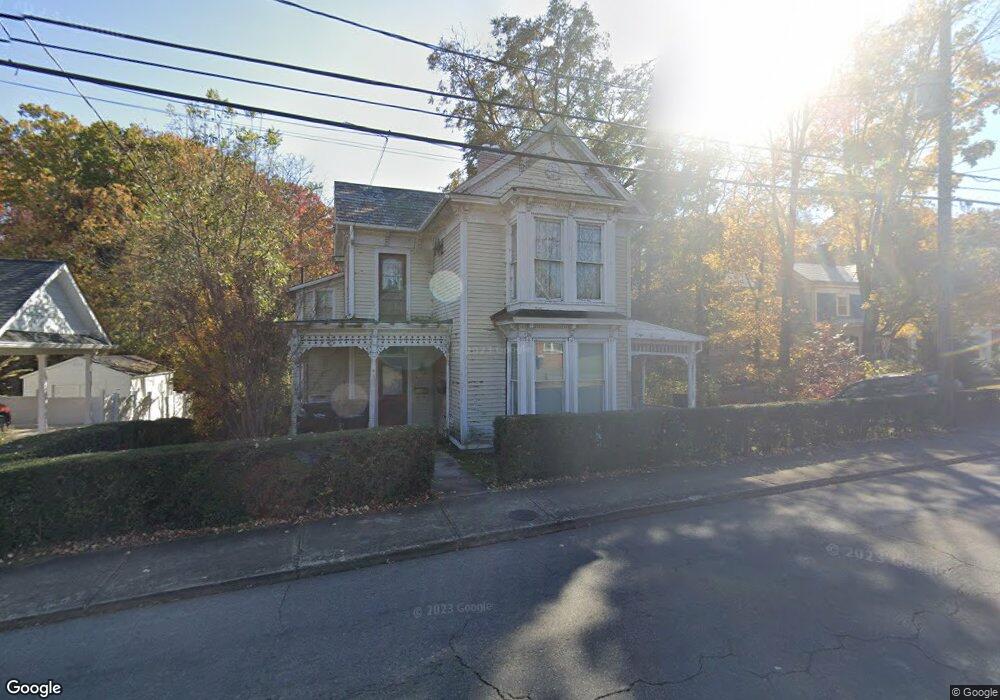
411 W Main St Greeneville, TN 37743
Estimated Value: $261,818 - $372,000
3
Beds
2
Baths
2,217
Sq Ft
$142/Sq Ft
Est. Value
About This Home
This home is located at 411 W Main St, Greeneville, TN 37743 and is currently estimated at $314,705, approximately $141 per square foot. 411 W Main St is a home located in Greene County with nearby schools including Greeneville Middle School, Greeneville High School, and Greeneville Adventist Academy.
Ownership History
Date
Name
Owned For
Owner Type
Purchase Details
Closed on
Mar 8, 2004
Sold by
Eddins William
Bought by
Easley David
Current Estimated Value
Home Financials for this Owner
Home Financials are based on the most recent Mortgage that was taken out on this home.
Original Mortgage
$125,000
Outstanding Balance
$57,275
Interest Rate
5.72%
Estimated Equity
$257,430
Purchase Details
Closed on
Dec 3, 2002
Sold by
Broyles Jamie E
Bought by
Eddins William
Purchase Details
Closed on
Feb 14, 1997
Sold by
Broyles Tim
Bought by
Kerley Don
Home Financials for this Owner
Home Financials are based on the most recent Mortgage that was taken out on this home.
Original Mortgage
$76,500
Interest Rate
7.91%
Create a Home Valuation Report for This Property
The Home Valuation Report is an in-depth analysis detailing your home's value as well as a comparison with similar homes in the area
Purchase History
| Date | Buyer | Sale Price | Title Company |
|---|---|---|---|
| Easley David | $125,000 | -- | |
| Eddins William | $115,000 | -- | |
| Kerley Don | $86,500 | -- |
Source: Public Records
Mortgage History
| Date | Status | Borrower | Loan Amount |
|---|---|---|---|
| Open | Kerley Don | $125,000 | |
| Previous Owner | Kerley Don | $76,500 |
Source: Public Records
Tax History
| Year | Tax Paid | Tax Assessment Tax Assessment Total Assessment is a certain percentage of the fair market value that is determined by local assessors to be the total taxable value of land and additions on the property. | Land | Improvement |
|---|---|---|---|---|
| 2025 | $1,764 | $53,750 | $9,500 | $44,250 |
| 2024 | $1,764 | $53,750 | $9,500 | $44,250 |
| 2023 | $1,764 | $53,750 | $0 | $0 |
| 2022 | $1,527 | $36,675 | $7,325 | $29,350 |
| 2021 | $1,527 | $36,675 | $7,325 | $29,350 |
| 2020 | $1,489 | $36,675 | $7,325 | $29,350 |
| 2019 | $1,489 | $35,775 | $7,325 | $28,450 |
| 2018 | $1,443 | $35,775 | $7,325 | $28,450 |
| 2017 | $1,134 | $28,525 | $7,325 | $21,200 |
| 2016 | $1,106 | $28,525 | $7,325 | $21,200 |
| 2015 | $1,219 | $31,450 | $7,325 | $24,125 |
| 2014 | $1,166 | $31,450 | $7,325 | $24,125 |
Source: Public Records
Map
Nearby Homes
Your Personal Tour Guide
Ask me questions while you tour the home.