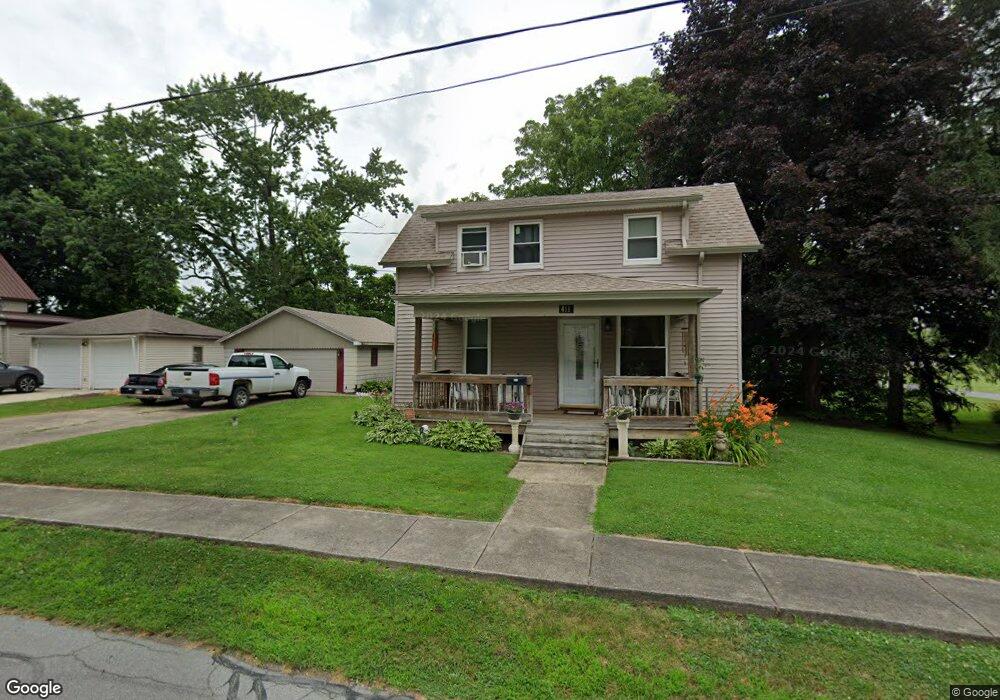
411 Wabash Ave La Porte, IN 46350
Estimated Value: $135,000 - $194,000
2
Beds
1
Bath
1,394
Sq Ft
$117/Sq Ft
Est. Value
About This Home
This home is located at 411 Wabash Ave, La Porte, IN 46350 and is currently estimated at $163,318, approximately $117 per square foot. 411 Wabash Ave is a home located in LaPorte County with nearby schools including La Porte High School, Riley Elementary School, and Dunkerton High School.
Ownership History
Date
Name
Owned For
Owner Type
Purchase Details
Closed on
Nov 7, 2017
Sold by
Miller Melissa L and Holzapfel Melissa L
Bought by
Miller Melissa L
Current Estimated Value
Home Financials for this Owner
Home Financials are based on the most recent Mortgage that was taken out on this home.
Original Mortgage
$46,400
Outstanding Balance
$25,549
Interest Rate
3.91%
Mortgage Type
New Conventional
Estimated Equity
$137,769
Purchase Details
Closed on
Dec 12, 2011
Sold by
Miller Drew H
Bought by
Miller Melissa L and Holzapfel Melissa L
Create a Home Valuation Report for This Property
The Home Valuation Report is an in-depth analysis detailing your home's value as well as a comparison with similar homes in the area
Home Values in the Area
Average Home Value in this Area
Purchase History
| Date | Buyer | Sale Price | Title Company |
|---|---|---|---|
| Miller Melissa L | -- | None Available | |
| Miller Melissa L | -- | None Available |
Source: Public Records
Mortgage History
| Date | Status | Borrower | Loan Amount |
|---|---|---|---|
| Open | Miller Melissa L | $46,400 |
Source: Public Records
Tax History Compared to Growth
Tax History
| Year | Tax Paid | Tax Assessment Tax Assessment Total Assessment is a certain percentage of the fair market value that is determined by local assessors to be the total taxable value of land and additions on the property. | Land | Improvement |
|---|---|---|---|---|
| 2024 | $989 | $96,100 | $21,600 | $74,500 |
| 2023 | $910 | $91,000 | $18,600 | $72,400 |
| 2022 | $599 | $93,000 | $18,600 | $74,400 |
| 2021 | $599 | $86,800 | $18,600 | $68,200 |
| 2020 | $1,085 | $86,800 | $18,600 | $68,200 |
| 2019 | $1,133 | $108,500 | $25,700 | $82,800 |
| 2018 | $580 | $68,000 | $18,400 | $49,600 |
| 2017 | $497 | $61,500 | $16,500 | $45,000 |
| 2016 | $1,147 | $109,900 | $15,300 | $94,600 |
| 2014 | $1,130 | $113,000 | $15,300 | $97,700 |
Source: Public Records
Map
Nearby Homes
- N SR State Road 39
- V/l State Road 39
- VL State Road 39
- 000 State Road 39
- 1010 2nd St
- 0 State Road 39
- 607 J St
- 1522 Sallwasser Ave
- 1424 Weller Ave
- 412 Woodbine St
- 1401 Jefferson Ave
- 305 F St
- 1663 Stone Lake Dr
- 117 Patton St
- 513 1st St
- 411 E St
- 52 Victoria Cir
- 1409 Andrew Ave
- 710 Central Ave
- 720 Weller Ave