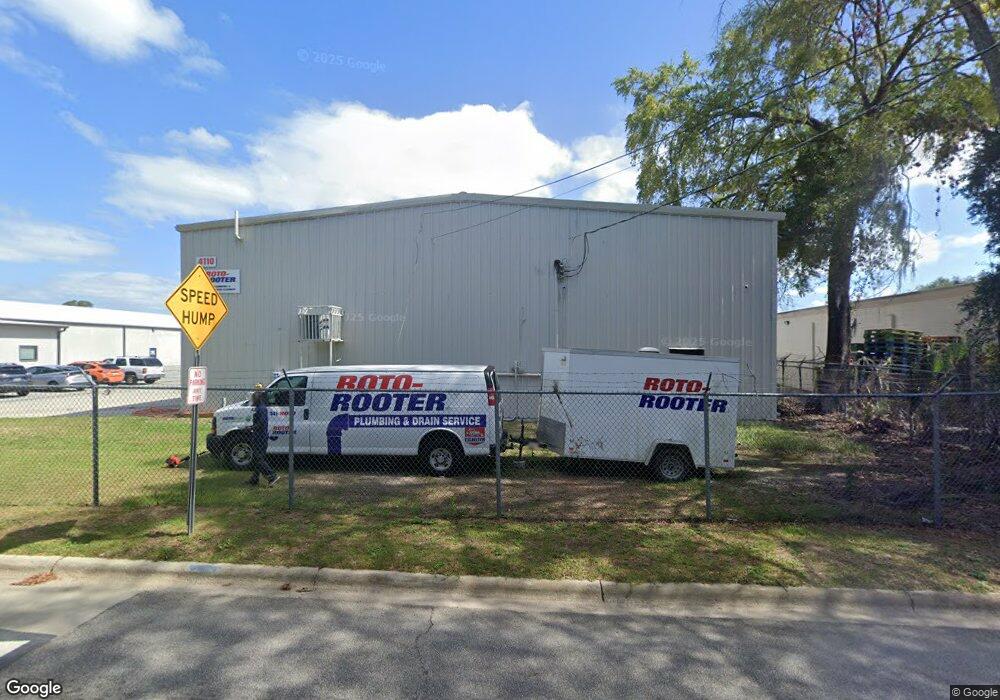
4110 Meding St Savannah, GA 31405
Feiler Park NeighborhoodEstimated Value: $546,138
--
Bed
--
Bath
4,588
Sq Ft
$119/Sq Ft
Est. Value
About This Home
This home is located at 4110 Meding St, Savannah, GA 31405 and is currently estimated at $546,138, approximately $119 per square foot. 4110 Meding St is a home located in Chatham County with nearby schools including Haven Elementary School, Myers Middle School, and Beach High School.
Ownership History
Date
Name
Owned For
Owner Type
Purchase Details
Closed on
Apr 29, 2013
Sold by
Bennett Brian
Bought by
Epr Family Limited Partnership
Current Estimated Value
Purchase Details
Closed on
Feb 22, 2011
Sold by
Galin Mortgage Lending Llc
Bought by
Bennett Brian
Purchase Details
Closed on
Feb 21, 2011
Sold by
Reuther William Dean
Bought by
Galin Mortgage Lending Llc
Purchase Details
Closed on
Mar 14, 2007
Sold by
Not Provided
Bought by
Bennett Brian
Home Financials for this Owner
Home Financials are based on the most recent Mortgage that was taken out on this home.
Original Mortgage
$127,280
Interest Rate
6.27%
Mortgage Type
New Conventional
Create a Home Valuation Report for This Property
The Home Valuation Report is an in-depth analysis detailing your home's value as well as a comparison with similar homes in the area
Home Values in the Area
Average Home Value in this Area
Purchase History
| Date | Buyer | Sale Price | Title Company |
|---|---|---|---|
| Epr Family Limited Partnership | $232,500 | -- | |
| Bennett Brian | $200,000 | -- | |
| Galin Mortgage Lending Llc | -- | -- | |
| Galin Mtg Lending Llc | -- | -- | |
| Bennett Brian | $140,000 | -- |
Source: Public Records
Mortgage History
| Date | Status | Borrower | Loan Amount |
|---|---|---|---|
| Previous Owner | Bennett Brian | $127,280 |
Source: Public Records
Tax History Compared to Growth
Tax History
| Year | Tax Paid | Tax Assessment Tax Assessment Total Assessment is a certain percentage of the fair market value that is determined by local assessors to be the total taxable value of land and additions on the property. | Land | Improvement |
|---|---|---|---|---|
| 2025 | $2,305 | $80,960 | $42,000 | $38,960 |
| 2024 | $2,305 | $80,800 | $42,000 | $38,800 |
| 2023 | $1,115 | $81,840 | $42,000 | $39,840 |
| 2022 | $2,175 | $74,560 | $42,000 | $32,560 |
| 2021 | $2,887 | $70,560 | $42,000 | $28,560 |
| 2020 | $2,549 | $80,720 | $42,000 | $38,720 |
| 2019 | $3,586 | $80,720 | $42,000 | $38,720 |
| 2018 | $2,636 | $83,480 | $42,000 | $41,480 |
| 2017 | $2,549 | $86,920 | $42,000 | $44,920 |
| 2016 | $2,594 | $88,920 | $40,800 | $48,120 |
| 2015 | $5,159 | $91,600 | $40,800 | $50,800 |
| 2014 | $4,876 | $93,000 | $0 | $0 |
Source: Public Records
Map
Nearby Homes