
Seller's Agent in 2025
Chen Liang
KW One Legacy Partners, LLC
(785) 438-7874
220 Total Sales
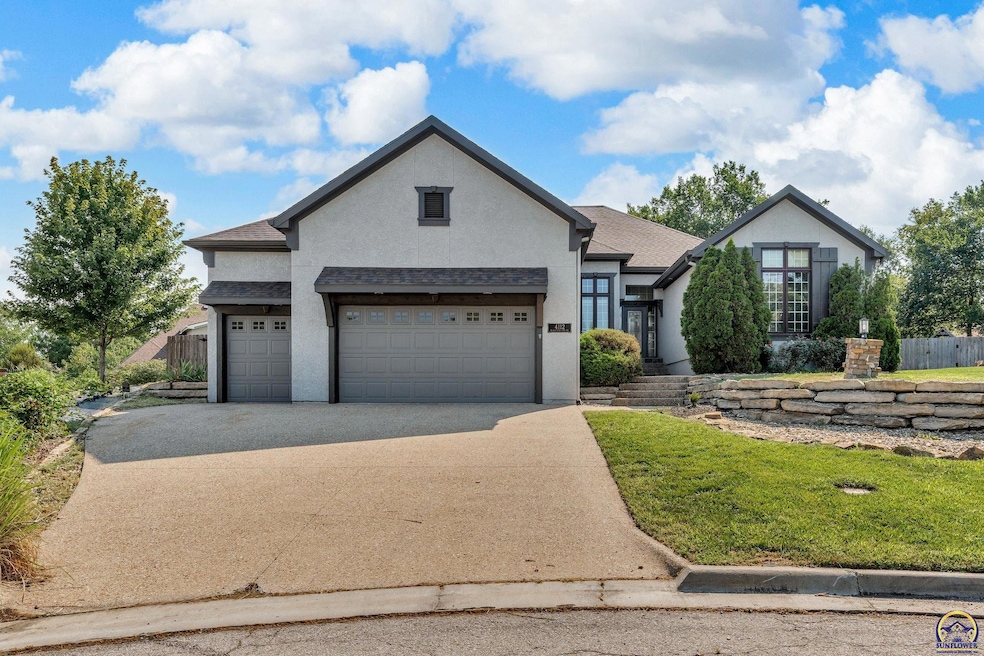


Welcome to this luxurious 5 bedroom, 3 bath home for sale, with over 4,000 sqft of living space located in Lawrence KS. Nestled in a cul-de-sac within walking distance of Sunflower Elementary & Southwest Middle Schools. Outside, enjoy a spacious fenced yard with patio, perfect for gatherings. A storage shed keeps everything organized, while the firepit sets the scene for crisp fall evenings. The 3-car garage includes electric vehicle charging for modern ease. Inside, an expansive living & dining room combo showcases gleaming hardwood floors, soaring ceilings, large windows that fill the space with light, a chandelier & a double-sided stone fireplace that adds warmth & charm. The chef’s kitchen features granite countertops, custom hickory cabinets, a large island, double oven, built-in microwave & dining area that opens to the patio for easy indoor-outdoor living. Added touches include a fireplace, large pantry, office nook, coffee bar & drop zone. All appliances stay. The laundry room off the garage offers a wash sink, countertops, & abundant storage. The primary suite is a true retreat with tall ceilings, natural light, walk-in closet & a double-sided fireplace leading to a spa-like bath with jetted tub, double vanity & walk-in shower. The main level also includes a second bedroom & full bath. A stunning curved staircase leads to the finished basement with wet bar, fridge, surround sound, fireplace, media room, 3 bedrooms with walk-in closets, a full bath & generous storage—perfect for entertaining or everyday living. *Some photos have been virtually staged to show potential use of space.
Last Agent to Sell the Property
KW One Legacy Partners, LLC License #SP00234742 Listed on: 08/10/2025
Last Buyer's Agent
House Non Member
SUNFLOWER ASSOCIATION OF REALT
| Date | Type | Sale Price | Title Company |
|---|---|---|---|
| Warranty Deed | -- | Lawyers Title | |
| Warranty Deed | -- | None Listed On Document | |
| Corporate Deed | -- | Capital Title Ins Co Lc |
| Date | Status | Loan Amount | Loan Type |
|---|---|---|---|
| Open | $533,398 | FHA | |
| Previous Owner | $341,600 | Fannie Mae Freddie Mac | |
| Closed | $42,270 | No Value Available |
| Date | Event | Price | List to Sale | Price per Sq Ft |
|---|---|---|---|---|
| 12/02/2025 12/02/25 | Sold | -- | -- | -- |
| 11/16/2025 11/16/25 | Pending | -- | -- | -- |
| 10/09/2025 10/09/25 | Price Changed | $584,000 | -2.7% | $136 / Sq Ft |
| 08/10/2025 08/10/25 | For Sale | $599,900 | -- | $140 / Sq Ft |
| Year | Tax Paid | Tax Assessment Tax Assessment Total Assessment is a certain percentage of the fair market value that is determined by local assessors to be the total taxable value of land and additions on the property. | Land | Improvement |
|---|---|---|---|---|
| 2025 | $9,353 | $74,290 | $9,344 | $64,946 |
| 2024 | $8,639 | $68,675 | $7,475 | $61,200 |
| 2023 | $8,318 | $64,170 | $5,520 | $58,650 |
| 2022 | $7,930 | $60,778 | $5,060 | $55,718 |
| 2021 | $7,532 | $56,114 | $4,830 | $51,284 |
| 2020 | $7,492 | $56,097 | $4,830 | $51,267 |
| 2019 | $7,452 | $55,856 | $4,830 | $51,026 |
| 2018 | $7,487 | $55,706 | $4,600 | $51,106 |
| 2017 | $7,487 | $55,085 | $4,600 | $50,485 |
| 2016 | $6,221 | $47,852 | $5,173 | $42,679 |
| 2015 | $5,993 | $46,104 | $5,173 | $40,931 |
| 2014 | $5,917 | $45,966 | $5,173 | $40,793 |
Seller's Agent in 2025
Chen Liang
KW One Legacy Partners, LLC
(785) 438-7874
220 Total Sales
H
Buyer's Agent in 2025
House Non Member
SUNFLOWER ASSOCIATION OF REALT
Source: Sunflower Association of REALTORS®
MLS Number: 240816
APN: 023-112-10-0-20-14-002.00-0
Disclaimer: Certain information contained herein is derived from information provided by parties other than Homes.com. All information provided is deemed reliable, but is not guaranteed to be accurate and should be independently verified.
![]() Based on information submitted to the MLS GRID. All data is obtained from various sources and may not have been verified by broker or MLS GRID. Supplied Open House Information is subject to change without notice. All information should be independently reviewed and verified for accuracy. Properties may or may not be listed by the office/agent presenting the information. Some IDX listings have been excluded from this website.
Based on information submitted to the MLS GRID. All data is obtained from various sources and may not have been verified by broker or MLS GRID. Supplied Open House Information is subject to change without notice. All information should be independently reviewed and verified for accuracy. Properties may or may not be listed by the office/agent presenting the information. Some IDX listings have been excluded from this website.
Based on information submitted to the MLS GRID
Ask me questions while you tour the home.