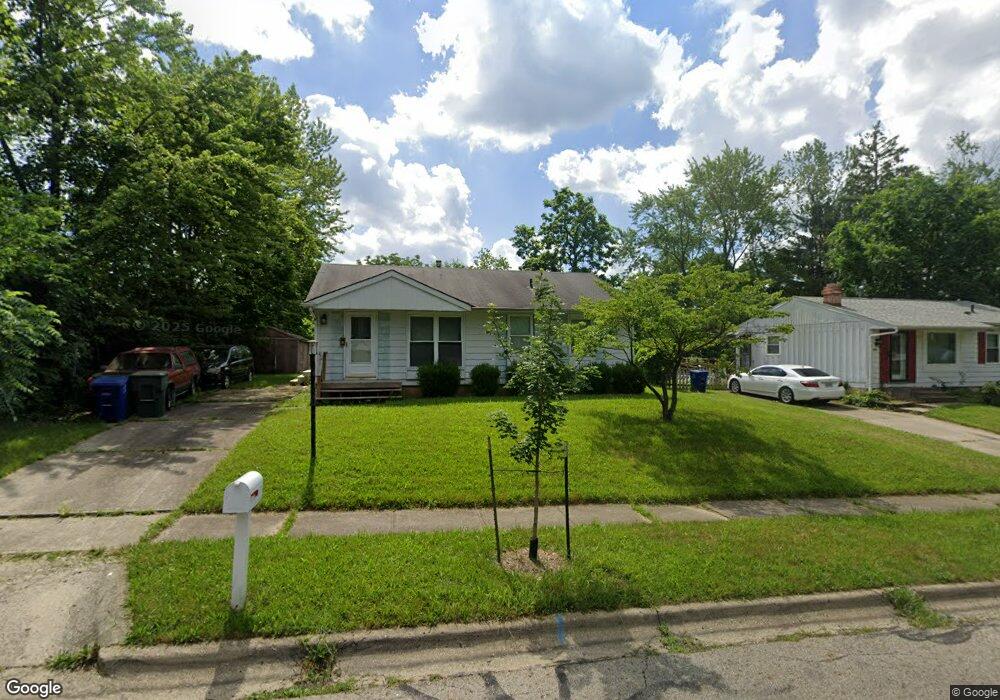
4112 Chesford Rd Columbus, OH 43224
Hyde Park NeighborhoodEstimated Value: $186,565 - $218,000
3
Beds
1
Bath
925
Sq Ft
$214/Sq Ft
Est. Value
About This Home
This home is located at 4112 Chesford Rd, Columbus, OH 43224 and is currently estimated at $198,391, approximately $214 per square foot. 4112 Chesford Rd is a home located in Franklin County with nearby schools including Innis Elementary School, Mifflin Middle School, and Mifflin High School.
Ownership History
Date
Name
Owned For
Owner Type
Purchase Details
Closed on
Dec 15, 2006
Sold by
Righter Andrea D and Righter John Albert
Bought by
Duff John E
Current Estimated Value
Home Financials for this Owner
Home Financials are based on the most recent Mortgage that was taken out on this home.
Original Mortgage
$83,142
Interest Rate
6.19%
Mortgage Type
FHA
Purchase Details
Closed on
May 15, 2002
Sold by
Dilyard David A and Dilyard Melinda S
Bought by
Brown Andrea D
Home Financials for this Owner
Home Financials are based on the most recent Mortgage that was taken out on this home.
Original Mortgage
$75,701
Interest Rate
7%
Mortgage Type
FHA
Purchase Details
Closed on
Dec 18, 1996
Sold by
Gibb Donald S
Bought by
Dilyard David A and Dilyard Melinda S
Home Financials for this Owner
Home Financials are based on the most recent Mortgage that was taken out on this home.
Original Mortgage
$62,600
Interest Rate
7.74%
Mortgage Type
New Conventional
Purchase Details
Closed on
Apr 24, 1992
Purchase Details
Closed on
Nov 15, 1990
Create a Home Valuation Report for This Property
The Home Valuation Report is an in-depth analysis detailing your home's value as well as a comparison with similar homes in the area
Home Values in the Area
Average Home Value in this Area
Purchase History
| Date | Buyer | Sale Price | Title Company |
|---|---|---|---|
| Duff John E | $83,800 | Lawyers Tit | |
| Brown Andrea D | $76,300 | -- | |
| Dilyard David A | $65,900 | -- | |
| -- | $59,900 | -- | |
| -- | -- | -- |
Source: Public Records
Mortgage History
| Date | Status | Borrower | Loan Amount |
|---|---|---|---|
| Previous Owner | Duff John E | $83,142 | |
| Previous Owner | Brown Andrea D | $75,701 | |
| Previous Owner | Dilyard David A | $62,600 |
Source: Public Records
Tax History Compared to Growth
Tax History
| Year | Tax Paid | Tax Assessment Tax Assessment Total Assessment is a certain percentage of the fair market value that is determined by local assessors to be the total taxable value of land and additions on the property. | Land | Improvement |
|---|---|---|---|---|
| 2024 | $2,141 | $57,510 | $17,120 | $40,390 |
| 2023 | $2,142 | $57,505 | $17,115 | $40,390 |
| 2022 | $1,297 | $33,750 | $8,370 | $25,380 |
| 2021 | $1,299 | $33,750 | $8,370 | $25,380 |
| 2020 | $1,301 | $33,750 | $8,370 | $25,380 |
| 2019 | $1,202 | $28,570 | $6,970 | $21,600 |
| 2018 | $970 | $28,570 | $6,970 | $21,600 |
| 2017 | $1,202 | $28,570 | $6,970 | $21,600 |
| 2016 | $816 | $21,070 | $4,270 | $16,800 |
| 2015 | $741 | $21,070 | $4,270 | $16,800 |
| 2014 | $743 | $21,070 | $4,270 | $16,800 |
| 2013 | $477 | $24,780 | $5,005 | $19,775 |
Source: Public Records
Map
Nearby Homes
- 4161 Grayfriars Ln
- 2640 Milverton Way
- 4216 Grayfriars Ln
- 2547 Ferris Park Dr S
- 2529 Ferris Park Dr S
- 4169 Commander Ln
- 4279 Morsetown Ct
- 4266 Morsetown Ct
- 4246 Morsetowne Ct E
- 4090 Cleveland Ave
- 3010 Bennington Ave
- 3098 Bennington Ave
- 2594 Adda Ave
- 2853 Stonecreek Ct Unit 2853
- 2625 Clybourne Rd
- 2283 Ward Rd
- 0 Ashbury Rd
- 0 Abington Rd Unit 224031739
- 0 Abington Rd Unit 224031704
- 0 Abington Rd Unit 224031738
- 4104 Chesford Rd
- 4128 Chesford Rd
- 4096 Chesford Rd
- 4117 Chesford Rd
- 4111 Chesford Rd
- 4125 Chesford Rd
- 4134 Chesford Rd
- 4103 Chesford Rd
- 2746 Saville Row
- 2756 Saville Row
- 4133 Chesford Rd
- 4088 Chesford Rd
- 2736 Saville Row
- 4095 Chesford Rd
- 2724 Saville Row
- 4142 Chesford Rd
- 4141 Chesford Rd
- 4043 Westerville Rd
- 2764 Saville Row
- 4065 Westerville Rd