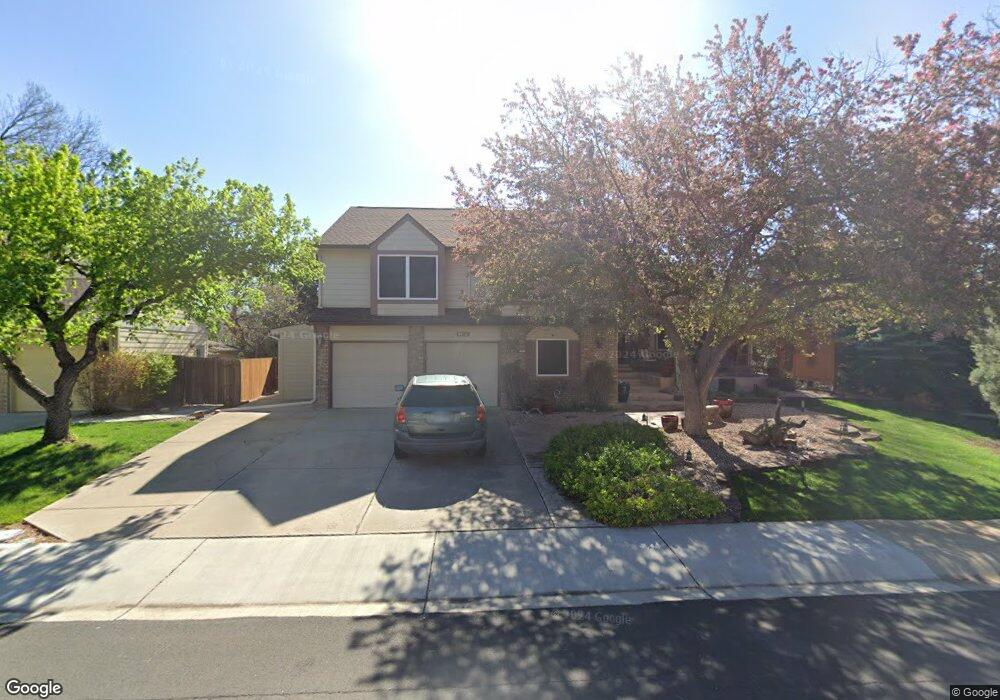
4112 Sherman Ct Fort Collins, CO 80525
Golden Meadows NeighborhoodEstimated Value: $655,936 - $739,000
3
Beds
4
Baths
2,429
Sq Ft
$282/Sq Ft
Est. Value
About This Home
This home is located at 4112 Sherman Ct, Fort Collins, CO 80525 and is currently estimated at $684,234, approximately $281 per square foot. 4112 Sherman Ct is a home located in Larimer County with nearby schools including Kruse Elementary School, Boltz Middle School, and Fort Collins High School.
Ownership History
Date
Name
Owned For
Owner Type
Purchase Details
Closed on
Jan 30, 2013
Sold by
Zamzow Stephen D
Bought by
Zamzow Stephen D and Zamzow Linda G
Current Estimated Value
Home Financials for this Owner
Home Financials are based on the most recent Mortgage that was taken out on this home.
Original Mortgage
$312,500
Outstanding Balance
$218,556
Interest Rate
3.42%
Mortgage Type
New Conventional
Estimated Equity
$465,678
Purchase Details
Closed on
Mar 30, 2006
Sold by
Zamzow Christopher J
Bought by
Zamzow Stephen D
Purchase Details
Closed on
May 12, 2003
Sold by
Zamzow Stephen
Bought by
Zamzow Christopher
Purchase Details
Closed on
May 5, 2003
Sold by
Zamzow Christopher
Bought by
Zamzow Stephen
Purchase Details
Closed on
Jul 1, 1995
Sold by
Michels Russell
Bought by
Zamzow Christopher
Create a Home Valuation Report for This Property
The Home Valuation Report is an in-depth analysis detailing your home's value as well as a comparison with similar homes in the area
Home Values in the Area
Average Home Value in this Area
Purchase History
| Date | Buyer | Sale Price | Title Company |
|---|---|---|---|
| Zamzow Stephen D | -- | Unified Title Company Of Nor | |
| Zamzow Stephen D | -- | None Available | |
| Zamzow Christopher | -- | -- | |
| Zamzow Stephen | -- | -- | |
| Zamzow Christopher | $180,000 | -- |
Source: Public Records
Mortgage History
| Date | Status | Borrower | Loan Amount |
|---|---|---|---|
| Open | Zamzow Stephen D | $312,500 |
Source: Public Records
Tax History Compared to Growth
Tax History
| Year | Tax Paid | Tax Assessment Tax Assessment Total Assessment is a certain percentage of the fair market value that is determined by local assessors to be the total taxable value of land and additions on the property. | Land | Improvement |
|---|---|---|---|---|
| 2025 | $3,465 | $46,498 | $3,685 | $42,813 |
| 2024 | $3,297 | $46,498 | $3,685 | $42,813 |
| 2022 | $2,524 | $33,680 | $3,823 | $29,857 |
| 2021 | $2,551 | $34,649 | $3,933 | $30,716 |
| 2020 | $2,572 | $34,635 | $3,933 | $30,702 |
| 2019 | $2,583 | $34,635 | $3,933 | $30,702 |
| 2018 | $2,215 | $31,500 | $3,960 | $27,540 |
| 2017 | $2,207 | $31,500 | $3,960 | $27,540 |
| 2016 | $2,726 | $29,858 | $4,378 | $25,480 |
| 2015 | $2,706 | $29,860 | $4,380 | $25,480 |
| 2014 | $2,311 | $25,330 | $4,380 | $20,950 |
Source: Public Records
Map
Nearby Homes
- 4407 San Remo Cir
- 1213 Ashlawn Ct
- 4238 Gemstone Ln
- 1621 Alcott St
- 3500 Carlton Ave Unit U49
- 3500 Carlton Ave Unit C18
- 2021 Timberline Ln
- 3465 Lochwood Dr Unit S91
- 4751 Pleasant Oak Dr Unit C83
- 4751 Pleasant Oak Dr Unit C65
- 4130 Suncrest Dr
- 1125 Oakmont Ct
- 1012 Driftwood Dr
- 818 Maxwell Ct
- 949 Kingston Dr
- 4501 Seaboard Ln
- 4513 Seaboard Ln
- 1919 Jamison Dr
- 4502 E Boardwalk Dr
- 3207 Greenwood Ct
- 4106 Sherman Ct
- 1524 Ticonderoga Dr
- 1600 Ticonderoga Dr
- 4113 Attleboro Ct
- 4119 Attleboro Ct
- 4107 Attleboro Ct
- 4100 Sherman Ct
- 4113 Sherman Ct
- 4107 Sherman Ct
- 1512 Ticonderoga Dr
- 4101 Attleboro Ct
- 4101 Sherman Ct
- 1601 Ticonderoga Dr
- 1525 Ticonderoga Dr
- 4112 Attleboro Ct
- 4118 Attleboro Ct
- 1519 Ticonderoga Dr
- 1607 Ticonderoga Dr
- 4112 Mill Run Ct
- 4101 Torrington Ct