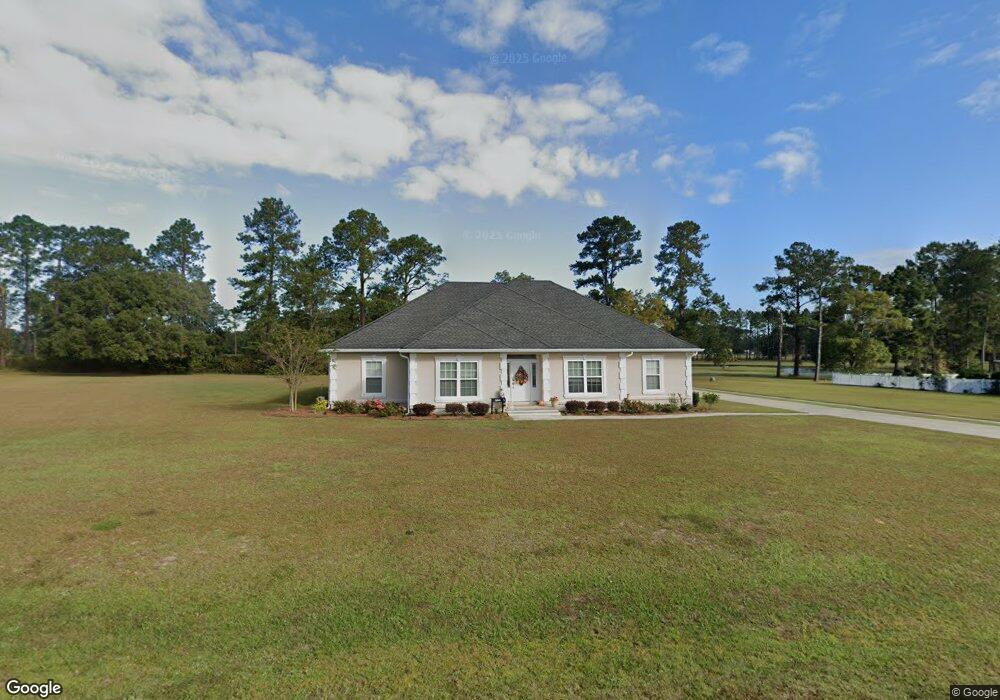
4113 Mulligan Cir Blackshear, GA 31516
Estimated Value: $388,023 - $448,000
4
Beds
3
Baths
2,392
Sq Ft
$173/Sq Ft
Est. Value
About This Home
This home is located at 4113 Mulligan Cir, Blackshear, GA 31516 and is currently estimated at $412,756, approximately $172 per square foot. 4113 Mulligan Cir is a home located in Pierce County with nearby schools including Pierce County High School, Southeast Christian Academy, and Truth Christian Academy.
Ownership History
Date
Name
Owned For
Owner Type
Purchase Details
Closed on
Aug 4, 2020
Sold by
Johnson Kenneth R
Bought by
Padgett Joni E
Current Estimated Value
Purchase Details
Closed on
Jun 3, 2013
Sold by
Primesouth Bank
Bought by
Johnson Kenneth R
Purchase Details
Closed on
Jul 26, 2012
Sold by
Pope Jonathan E
Bought by
Primesouth Bank
Purchase Details
Closed on
Mar 24, 2008
Sold by
Hurst William C
Bought by
Pope Jonathan E
Purchase Details
Closed on
Mar 15, 2004
Sold by
H & H Investment Properties In
Bought by
H & H Investment Properties Inc
Purchase Details
Closed on
Dec 30, 2003
Sold by
Greene Chance Walker Etal
Bought by
Whitaker Sandra
Purchase Details
Closed on
Jun 11, 2001
Sold by
Whitaker Sandra W
Bought by
Greene Chance Walker Etal
Purchase Details
Closed on
Aug 18, 1937
Sold by
Walker Ben
Bought by
Walker Ben
Create a Home Valuation Report for This Property
The Home Valuation Report is an in-depth analysis detailing your home's value as well as a comparison with similar homes in the area
Home Values in the Area
Average Home Value in this Area
Purchase History
| Date | Buyer | Sale Price | Title Company |
|---|---|---|---|
| Padgett Joni E | $255,000 | -- | |
| Johnson Kenneth R | $18,000 | -- | |
| Primesouth Bank | -- | -- | |
| Pope Jonathan E | $34,000 | -- | |
| H & H Investment Properties Inc | -- | -- | |
| Whitaker Sandra | -- | -- | |
| Greene Chance Walker Etal | -- | -- | |
| Whitaker Sandra W | -- | -- | |
| Walker Ben | -- | -- |
Source: Public Records
Tax History Compared to Growth
Tax History
| Year | Tax Paid | Tax Assessment Tax Assessment Total Assessment is a certain percentage of the fair market value that is determined by local assessors to be the total taxable value of land and additions on the property. | Land | Improvement |
|---|---|---|---|---|
| 2024 | $2,181 | $134,894 | $12,000 | $122,894 |
| 2023 | $2,181 | $133,259 | $12,000 | $121,259 |
| 2022 | $2,496 | $102,893 | $11,176 | $91,717 |
| 2021 | $2,626 | $99,057 | $11,176 | $87,881 |
| 2020 | $2,563 | $95,222 | $11,176 | $84,046 |
| 2019 | $2,361 | $95,222 | $11,176 | $84,046 |
| 2018 | $2,354 | $91,386 | $11,176 | $80,210 |
| 2017 | $2,441 | $88,851 | $11,176 | $77,675 |
| 2016 | $2,368 | $88,851 | $11,176 | $77,675 |
| 2015 | $297 | $88,851 | $11,176 | $77,675 |
| 2014 | $297 | $53,895 | $11,176 | $42,719 |
| 2013 | $297 | $11,176 | $11,176 | $0 |
Source: Public Records
Map
Nearby Homes
- 4131 Mulligan Cir
- 3951 Golfview Dr
- 3930 Golfview Dr
- 5605 Ga Highway 121
- 6324 Bailey Rd
- 1207 College Ave
- 1114 Laurel St
- 4119 Renee Ln
- 4160 Deerwood Ln
- 1120 College Ave
- 3602 Meadow Ln
- 209 Woodlawn Terrace
- 118 Pinehurst Dr
- 113 Tatum Ln
- 936 Azalea St
- 933 Azalea St
- 6499 Bailey Rd
- 4582 Saint Johns Church Rd
- 915 Jane St
- 830 Jane St
- 4111 Mulligan Cir
- 4112 Mulligan Cir
- 4115 Mulligan Cir
- 4117 Mulligan Cir
- 4109 Mulligan Cir
- 4110 Mulligan Cir
- 4124 Mulligan Cir
- 4126 Mulligan Cir
- 4119 Mulligan Cir
- 4107 Mulligan Cir
- 4128 Mulligan Cir
- 4108 Mulligan Cir
- Lot 6 Mulligan Cir
- 5 Mulligan Cir
- 0 Mulligan Cir
- 4106 Mulligan Cir
- 4121 Mulligan Cir
- 4125 Mulligan Cir
- 4123 Mulligan Cir
- 4127 Mulligan Cir