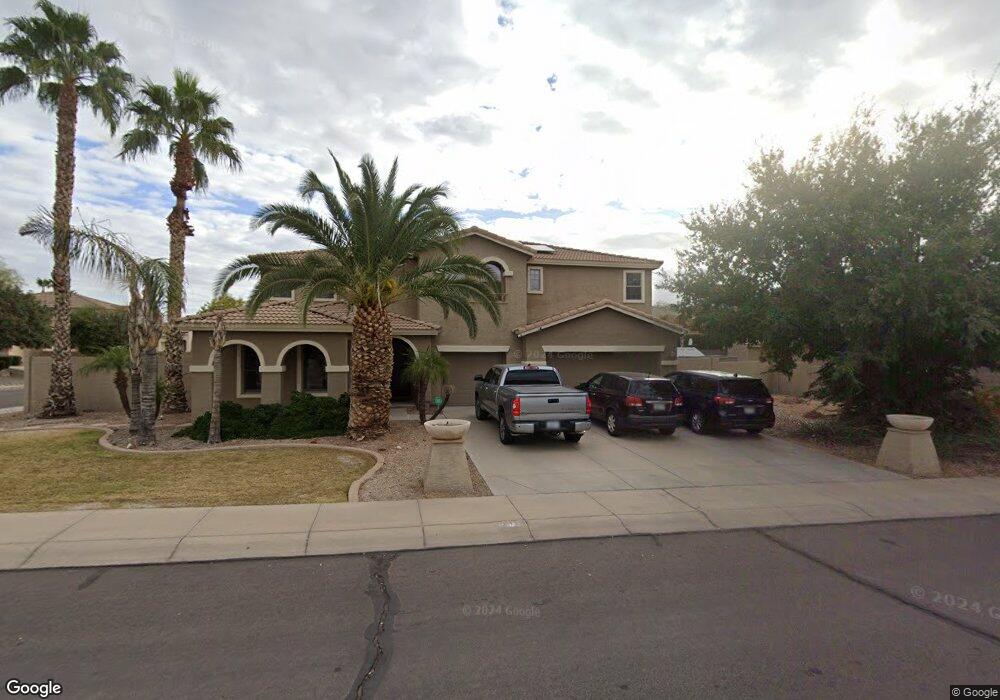
4113 S Chatham Mesa, AZ 85212
Superstition Vistas NeighborhoodEstimated Value: $697,871 - $809,000
Studio
5
Baths
4,262
Sq Ft
$174/Sq Ft
Est. Value
About This Home
This home is located at 4113 S Chatham, Mesa, AZ 85212 and is currently estimated at $741,218, approximately $173 per square foot. 4113 S Chatham is a home located in Maricopa County with nearby schools including Desert Ridge Jr. High School, Desert Ridge High School, and Ala Mesa.
Ownership History
Date
Name
Owned For
Owner Type
Purchase Details
Closed on
Oct 2, 2010
Sold by
Shipman Ronald and Shipman Stephanie
Bought by
Shipman Ronald
Current Estimated Value
Purchase Details
Closed on
Apr 8, 2005
Sold by
Shipman Ronald
Bought by
Shipman Ronald and Shipman Stephanie
Purchase Details
Closed on
Aug 26, 2003
Sold by
Richmond American Homes Of Arizona Inc
Bought by
Shipman Ronald
Home Financials for this Owner
Home Financials are based on the most recent Mortgage that was taken out on this home.
Original Mortgage
$266,529
Outstanding Balance
$118,176
Interest Rate
5.6%
Mortgage Type
VA
Estimated Equity
$623,042
Create a Home Valuation Report for This Property
The Home Valuation Report is an in-depth analysis detailing your home's value as well as a comparison with similar homes in the area
Home Values in the Area
Average Home Value in this Area
Purchase History
| Date | Buyer | Sale Price | Title Company |
|---|---|---|---|
| Shipman Ronald | -- | None Available | |
| Shipman Ronald | -- | -- | |
| Shipman Ronald | $262,214 | Fidelity National Title |
Source: Public Records
Mortgage History
| Date | Status | Borrower | Loan Amount |
|---|---|---|---|
| Open | Shipman Ronald | $266,529 |
Source: Public Records
Tax History
| Year | Tax Paid | Tax Assessment Tax Assessment Total Assessment is a certain percentage of the fair market value that is determined by local assessors to be the total taxable value of land and additions on the property. | Land | Improvement |
|---|---|---|---|---|
| 2025 | $2,960 | $39,697 | -- | -- |
| 2024 | $2,853 | $37,807 | -- | -- |
| 2023 | $2,853 | $53,160 | $10,630 | $42,530 |
| 2022 | $2,783 | $40,520 | $8,100 | $32,420 |
| 2021 | $3,015 | $36,210 | $7,240 | $28,970 |
| 2020 | $2,962 | $34,310 | $6,860 | $27,450 |
| 2019 | $2,745 | $30,970 | $6,190 | $24,780 |
| 2018 | $2,613 | $30,270 | $6,050 | $24,220 |
| 2017 | $2,532 | $28,670 | $5,730 | $22,940 |
| 2016 | $2,612 | $31,020 | $6,200 | $24,820 |
| 2015 | $2,407 | $30,550 | $6,110 | $24,440 |
Source: Public Records
Map
Nearby Homes
- 11322 E Rembrandt Ave
- 11223 E Raleigh Ave Unit 3
- 11548 E Corbin Ave
- 4419 S Adelle
- 10933 E Renfield Ave
- 11533 E Quicksilver Ave
- 4539 S Antonio
- 11436 E Sonrisa Ave
- 11051 E Sebring Ave
- 11441 E Sonrisa Ave
- 10830 E Ramona Ave
- 3549 S Oxley Cir
- 3529 S Tambor Unit 1
- 10903 E Quade Ave
- 4613 S Dante Cir
- 4746 S Emery
- 11430 E Pronghorn Ave Unit 3
- 10853 E Sebring Ave
- 4755 S Grenoble Cir
- 11535 E Persimmon Ave
- 4121 S Chatham
- 4114 S Clancy
- 4122 S Clancy
- 11424 E Rembrandt Ave
- 4129 S Chatham
- 11416 E Rembrandt Ave
- 4112 S Chatham
- 4128 S Chatham
- 11408 E Rembrandt Ave
- 11432 E Rembrandt Ave
- 4132 S Clancy
- 11366 E Rembrandt Ave
- 11406 E Roselle Ave
- 11440 E Rembrandt Ave
- 11414 E Roselle Ave
- 11358 E Rembrandt Ave
- 4115 S Clancy
- 11422 E Roselle Ave
- 4123 S Clancy
- 4131 S Clancy
Your Personal Tour Guide
Ask me questions while you tour the home.