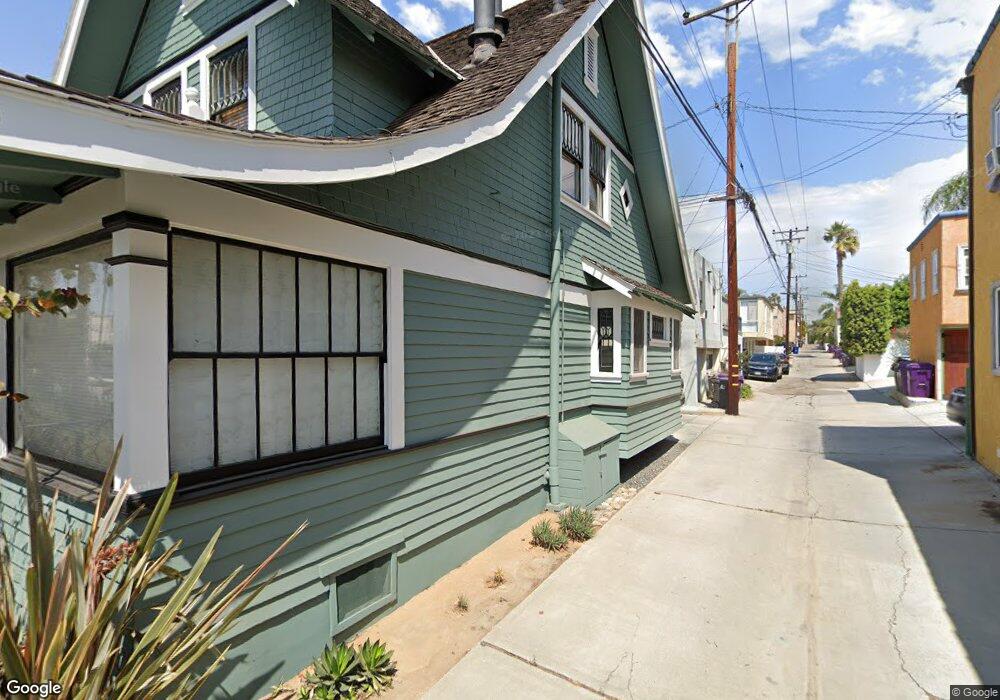
4119 E 2nd St Long Beach, CA 90803
Belmont Heights NeighborhoodEstimated Value: $1,607,000 - $1,779,000
About This Home
This home is located at 4119 E 2nd St, Long Beach, CA 90803 and is currently estimated at $1,701,725, approximately $621 per square foot. 4119 E 2nd St is a home located in Los Angeles County with nearby schools including Fremont Elementary School, Rogers Middle School, and Woodrow Wilson High School.
Ownership History
We collect this data history from publicly available records. To have your information removed, we recommend requesting removal directly through your county’s website.
Purchase Details
Home Financials for this Owner
Home Financials are based on the most recent Mortgage that was taken out on this home.Purchase Details
Home Financials for this Owner
Home Financials are based on the most recent Mortgage that was taken out on this home.Purchase Details
Purchase Details
Home Financials for this Owner
Home Financials are based on the most recent Mortgage that was taken out on this home.Purchase Details
Home Financials for this Owner
Home Financials are based on the most recent Mortgage that was taken out on this home.Purchase Details
Home Financials for this Owner
Home Financials are based on the most recent Mortgage that was taken out on this home.Home Values in the Area
Average Home Value in this Area
Purchase History
We collect this data history from publicly available records. To have your information removed, we recommend requesting removal directly through your county’s website.
| Date | Buyer | Sale Price | Title Company |
|---|---|---|---|
| -- | Ortc | ||
| -- | None Available | ||
| -- | Old Republic Title Company | ||
| -- | Old Republic Title Company | ||
| -- | None Available | ||
| -- | Lawyers Title | ||
| -- | Southland Title | ||
| $485,000 | North American Title Co |
Mortgage History
We collect this data history from publicly available records. To have your information removed, we recommend requesting removal directly through your county’s website.
| Date | Status | Borrower | Loan Amount |
|---|---|---|---|
| Open | $460,000 | ||
| Closed | $413,000 | ||
| Closed | $394,500 | ||
| Closed | $388,000 |
Tax History
We collect this data history from publicly available records. To have your information removed, we recommend requesting removal directly through your county’s website.
| Year | Tax Paid | Tax Assessment Tax Assessment Total Assessment is a certain percentage of the fair market value that is determined by local assessors to be the total taxable value of land and additions on the property. | Land | Improvement |
|---|---|---|---|---|
| 2025 | $10,036 | $745,818 | $495,742 | $250,076 |
| 2024 | $9,612 | $731,195 | $486,022 | $245,173 |
| 2023 | $9,453 | $716,859 | $476,493 | $240,366 |
| 2022 | $8,876 | $702,803 | $467,150 | $235,653 |
| 2021 | $8,694 | $689,024 | $457,991 | $231,033 |
| 2020 | $8,671 | $682,260 | $453,295 | $228,965 |
| 2019 | $8,570 | $668,889 | $444,407 | $224,482 |
| 2018 | $8,063 | $642,581 | $435,694 | $206,887 |
| 2016 | $7,423 | $617,342 | $418,776 | $198,566 |
| 2015 | $7,122 | $608,070 | $412,486 | $195,584 |
| 2014 | $7,073 | $596,159 | $404,406 | $191,753 |
Map
- 116 Termino Ave
- 4124 E Broadway
- 105 Roswell Ave
- 236 Belmont Ave
- 134 Bennett Ave
- 3921 E Livingston Dr
- 235 Termino Ave Unit 4
- 110 Bennett Ave
- 4401 E Division St
- 3819 E Livingston Dr Unit 9
- 3737 E 2nd St Unit 101
- 60 Bennett Ave
- 3811 E Livingston Dr Unit 1
- 25 Bennett Ave
- 3665 E 1st St Unit 208
- 4326 E Vista St
- 40 Ximeno Ave
- 3 Euclid Ave
- 254 Bennett Ave
- 169 Roycroft Ave
- 204 Belmont Ave
- 200 Belmont Ave
- 4101 E 2nd St
- 4121 E 2nd St
- 205 Roswell Ave
- 207 Roswell Ave
- 203 Roswell Ave
- 203 Belmont Ave Unit 6
- 4114 E Shaw St
- 207 Belmont Ave Unit C
- 211 Roswell Ave
- 4041 E 2nd St
- 209 Belmont Ave Unit d
- 209 Belmont Ave
- 213 Roswell Ave
- 211 Belmont Ave
- 4114 E 2nd St
- 132 Belmont Ave Unit A
- 4130 E 2nd St
- 135 Belmont Ave
Ask me questions while you tour the home.