
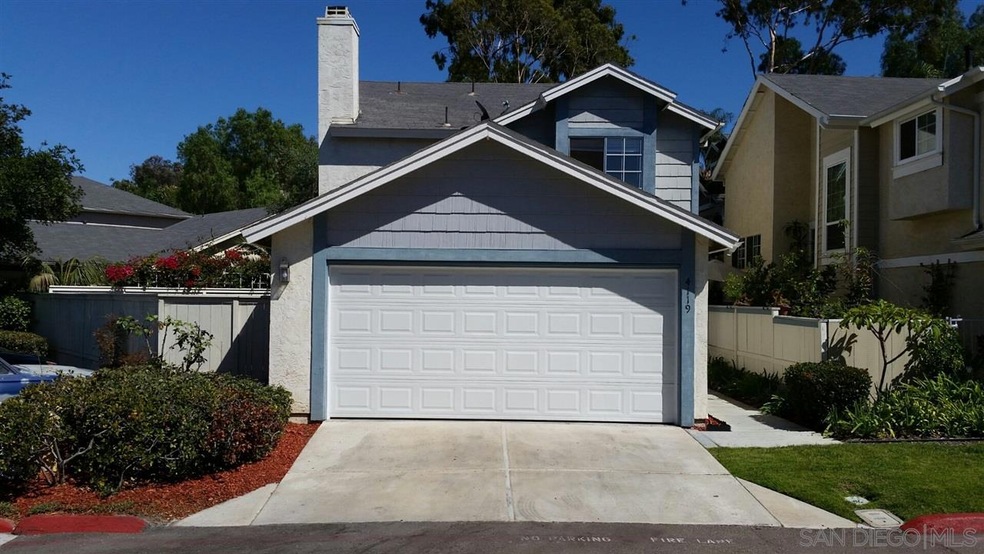
4119 Esperanza Way Oceanside, CA 92056
Peacock Neighborhood
3
Beds
2.5
Baths
1,486
Sq Ft
0.73
Acres
Highlights
- Wine Cellar
- Breakfast Area or Nook
- Community Playground
- Deck
- Cul-De-Sac
- Formal Entry
About This Home
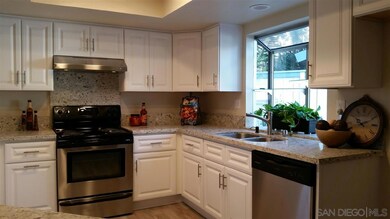
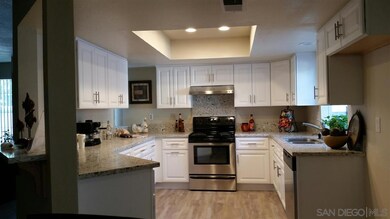
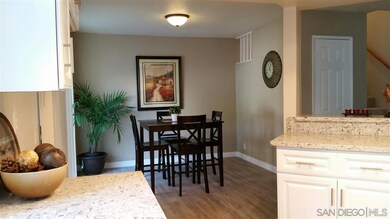
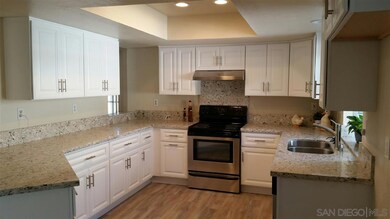
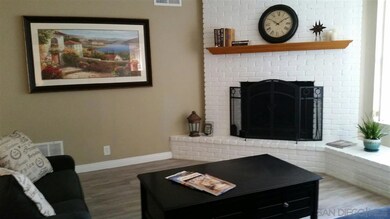
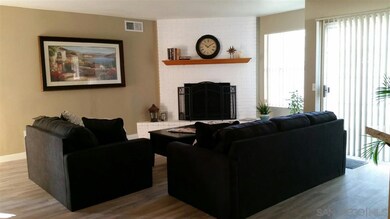
As of July 2020This Turn Key Property is Model Home Caliber. The home has been completely remodeled. The Brand New Upgrades include Granite Counter Tops, Extended Counter Space, Stainless Steel Appliances, an abundance of Cabinetry in the Kitchen, Granite Counter tops in the Bathrooms, and Desirable Hardwood Flooring throughout the first floor. On the second floor enjoy brand new upgraded Pad and Carpet. A low maintenance backyard, freshly painted interior & exterior Fence/Deck, and NEW Epoxy Coating in Garage.
Last Agent to Sell the Property
Arley Gonzalez
Coldwell Banker West License #01948211
Last Buyer's Agent
RENDER& HANNIGAN RENDER& HANNIGAN
Coldwell Banker-SM North License #70000539
Home Details
Home Type
- Single Family
Est. Annual Taxes
- $6,478
Year Built
- Built in 1990
Lot Details
- Cul-De-Sac
- Property is Fully Fenced
- Level Lot
- Sprinklers on Timer
- Unpaved Streets
HOA Fees
- $120 Monthly HOA Fees
Parking
- 2 Car Garage
- Garage Door Opener
- Guest Parking
Home Design
- Composition Roof
- Wood Siding
- Stucco Exterior
Interior Spaces
- 1,486 Sq Ft Home
- 2-Story Property
- Formal Entry
- Wine Cellar
- Living Room with Fireplace
- Dining Area
- Attic Fan
Kitchen
- Breakfast Area or Nook
- Oven or Range
- Dishwasher
- Disposal
Flooring
- Carpet
- Laminate
- Tile
Bedrooms and Bathrooms
- 3 Bedrooms
Laundry
- Laundry in Garage
- Gas Dryer Hookup
Outdoor Features
- Deck
Schools
- Vista Unified School District Elementary And Middle School
- Vista Unified School District High School
Utilities
- Gas Water Heater
- Satellite Dish
- Cable TV Available
Listing and Financial Details
- Assessor Parcel Number 162-531-19-00
Community Details
Overview
- Association fees include common area maintenance
- Bruner & Rosi Association, Phone Number (760) 603-9404
Recreation
- Community Playground
- Recreational Area
Ownership History
Date
Name
Owned For
Owner Type
Purchase Details
Closed on
Jul 25, 2022
Sold by
Gallegos Austin D
Bought by
Gallegos Living Trust
Total Days on Market
26
Current Estimated Value
Purchase Details
Listed on
May 10, 2020
Closed on
May 28, 2020
Sold by
Moore Gregory D and Moore Gregory D
Bought by
Gallegos Austin D
Seller's Agent
Doreen Pottios
HomeSmart Realty West
Buyer's Agent
Deborah Harper
Coldwell Banker Realty
List Price
$549,000
Sold Price
$557,500
Premium/Discount to List
$8,500
1.55%
Home Financials for this Owner
Home Financials are based on the most recent Mortgage that was taken out on this home.
Avg. Annual Appreciation
7.61%
Original Mortgage
$570,322
Interest Rate
3.2%
Mortgage Type
VA
Purchase Details
Listed on
Oct 21, 2016
Closed on
Nov 28, 2016
Sold by
Miller Charles Leo and Miller Martha Alicia
Bought by
Moore Gregory D
Seller's Agent
Arley Gonzalez
Coldwell Banker West
Buyer's Agent
RENDER& HANNIGAN RENDER& HANNIGAN
Coldwell Banker-SM North
List Price
$479,000
Sold Price
$460,000
Premium/Discount to List
-$19,000
-3.97%
Home Financials for this Owner
Home Financials are based on the most recent Mortgage that was taken out on this home.
Avg. Annual Appreciation
5.56%
Original Mortgage
$469,890
Interest Rate
3.54%
Mortgage Type
VA
Purchase Details
Closed on
Feb 15, 2005
Sold by
Miller Charles Leo and Miller Martha Alicia
Bought by
Miller Charles Leo and Miller Martha Alicia
Home Financials for this Owner
Home Financials are based on the most recent Mortgage that was taken out on this home.
Original Mortgage
$292,500
Interest Rate
1.37%
Mortgage Type
Negative Amortization
Purchase Details
Closed on
Sep 17, 1998
Sold by
Miller Charles L
Bought by
Miller Charles L and Miller Martha A
Home Financials for this Owner
Home Financials are based on the most recent Mortgage that was taken out on this home.
Original Mortgage
$131,548
Interest Rate
6.79%
Mortgage Type
VA
Purchase Details
Closed on
Feb 25, 1994
Sold by
Edwards Phyllis A
Bought by
Miller Charles L
Home Financials for this Owner
Home Financials are based on the most recent Mortgage that was taken out on this home.
Original Mortgage
$135,660
Interest Rate
7.84%
Mortgage Type
VA
Purchase Details
Closed on
Mar 29, 1989
Map
Create a Home Valuation Report for This Property
The Home Valuation Report is an in-depth analysis detailing your home's value as well as a comparison with similar homes in the area
Similar Homes in Oceanside, CA
Home Values in the Area
Average Home Value in this Area
Purchase History
| Date | Type | Sale Price | Title Company |
|---|---|---|---|
| Quit Claim Deed | -- | None Listed On Document | |
| Grant Deed | $557,500 | Ticor Title Company | |
| Interfamily Deed Transfer | -- | Ticor Title Company | |
| Grant Deed | $460,000 | First American Title Company | |
| Interfamily Deed Transfer | -- | -- | |
| Interfamily Deed Transfer | -- | California Title Company | |
| Grant Deed | $133,000 | Fidelity National Title | |
| Deed | $144,000 | -- |
Source: Public Records
Mortgage History
| Date | Status | Loan Amount | Loan Type |
|---|---|---|---|
| Previous Owner | $570,322 | VA | |
| Previous Owner | $469,890 | VA | |
| Previous Owner | $292,500 | Negative Amortization | |
| Previous Owner | $131,548 | VA | |
| Previous Owner | $135,660 | VA |
Source: Public Records
Property History
| Date | Event | Price | Change | Sq Ft Price |
|---|---|---|---|---|
| 07/02/2020 07/02/20 | Sold | $557,500 | +1.5% | $375 / Sq Ft |
| 05/16/2020 05/16/20 | Pending | -- | -- | -- |
| 05/10/2020 05/10/20 | For Sale | $549,000 | +19.3% | $369 / Sq Ft |
| 12/14/2016 12/14/16 | Sold | $460,000 | -4.0% | $310 / Sq Ft |
| 11/16/2016 11/16/16 | Pending | -- | -- | -- |
| 10/21/2016 10/21/16 | For Sale | $479,000 | -- | $322 / Sq Ft |
Source: San Diego MLS
Tax History
| Year | Tax Paid | Tax Assessment Tax Assessment Total Assessment is a certain percentage of the fair market value that is determined by local assessors to be the total taxable value of land and additions on the property. | Land | Improvement |
|---|---|---|---|---|
| 2024 | $6,478 | $591,623 | $403,259 | $188,364 |
| 2023 | $6,322 | $580,023 | $395,352 | $184,671 |
| 2022 | $6,307 | $568,650 | $387,600 | $181,050 |
| 2021 | $6,166 | $557,500 | $380,000 | $177,500 |
| 2020 | $5,364 | $488,153 | $183,508 | $304,645 |
| 2019 | $5,284 | $478,582 | $179,910 | $298,672 |
| 2018 | $5,021 | $469,199 | $176,383 | $292,816 |
| 2017 | $4,927 | $460,000 | $172,925 | $287,075 |
| 2016 | $2,094 | $190,940 | $71,779 | $119,161 |
| 2015 | $2,086 | $188,073 | $70,701 | $117,372 |
| 2014 | $2,036 | $184,390 | $69,317 | $115,073 |
Source: Public Records
Source: San Diego MLS
MLS Number: 160057308
APN: 162-531-19
Disclaimer: Certain information contained herein is derived from information provided by parties other than Homes.com. All information provided is deemed reliable, but is not guaranteed to be accurate and should be independently verified.
![]() This information is deemed reliable but not guaranteed. You should rely on this information only to decide whether or not to further investigate a particular property.
This information is deemed reliable but not guaranteed. You should rely on this information only to decide whether or not to further investigate a particular property.
BEFORE MAKING ANY OTHER DECISION, YOU SHOULD PERSONALLY INVESTIGATE THE FACTS (e.g. square footage and lot size) with the assistance of an appropriate professional. You may use this information only to identify properties you may be interested in investigating further. All uses except for personal, noncommercial use in accordance with the foregoing purpose are prohibited. Redistribution or copying of this information, any photographs or video tours is strictly
prohibited. This information is derived from the Internet Data Exchange (IDX) service provided by San Diego MLS. Displayed property listings may be held by a brokerage firm other than the broker and/or agent responsible for this display. The information and any photographs and video tours and the compilation from which they are derived is protected by copyright. Compilation © 2025 San Diego MLS.
Nearby Homes
- 4014 Olive Dr
- 2393 Callecita Way
- 1914 Radford St
- 1741 Ravine Rd
- 000000 College Blvd
- 2760 Thunder Dr
- 925 Ruby Dr
- 1854 Corte Segundo
- 1851 Corte Segundo
- 2729 Harriet St
- 1552 Merlot Ct
- 2774 College Blvd
- 4549 Quailridge Dr
- 1837 Avenida Sevilla
- 2802 College Blvd
- 4530 Beverly Glen Dr
- 527 Huff St
- 1478 Moon Rd
- 0 Galaxy Dr
- 523 Hatherly St