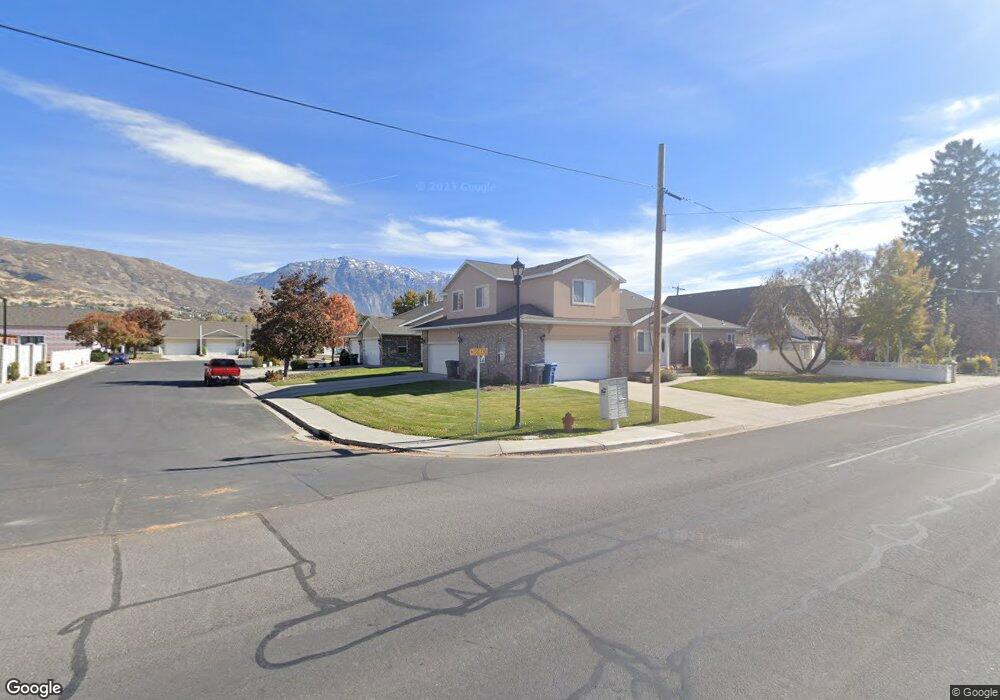
412 E 40 N Lindon, UT 84042
Estimated Value: $467,148 - $666,000
3
Beds
3
Baths
2,820
Sq Ft
$198/Sq Ft
Est. Value
About This Home
This home is located at 412 E 40 N, Lindon, UT 84042 and is currently estimated at $558,787, approximately $198 per square foot. 412 E 40 N is a home located in Utah County with nearby schools including Rocky Mountain Elementary, Oak Canyon Junior High School, and Pleasant Grove High School.
Ownership History
Date
Name
Owned For
Owner Type
Purchase Details
Closed on
Apr 29, 2020
Sold by
Chnstensen Brenda
Bought by
Zalo Llc
Current Estimated Value
Purchase Details
Closed on
Aug 19, 2004
Sold by
Carroll Mary Lou
Bought by
Christensen Brenda
Purchase Details
Closed on
Jul 5, 2001
Sold by
Westbrook Raymond C
Bought by
Westbrook Raymond C and Raymond C Westbrook Living Tru
Home Financials for this Owner
Home Financials are based on the most recent Mortgage that was taken out on this home.
Original Mortgage
$70,000
Interest Rate
7.14%
Purchase Details
Closed on
Jul 2, 2001
Sold by
Heritage Court Lc
Bought by
Westbrook Raymond C
Home Financials for this Owner
Home Financials are based on the most recent Mortgage that was taken out on this home.
Original Mortgage
$70,000
Interest Rate
7.14%
Create a Home Valuation Report for This Property
The Home Valuation Report is an in-depth analysis detailing your home's value as well as a comparison with similar homes in the area
Home Values in the Area
Average Home Value in this Area
Purchase History
| Date | Buyer | Sale Price | Title Company |
|---|---|---|---|
| Zalo Llc | -- | Highland Title | |
| Christensen Brenda | -- | Inwest Title Services Inc | |
| Westbrook Raymond C | -- | First American Title Co | |
| Westbrook Raymond C | -- | First American Title Insuran |
Source: Public Records
Mortgage History
| Date | Status | Borrower | Loan Amount |
|---|---|---|---|
| Previous Owner | Westbrook Raymond C | $70,000 |
Source: Public Records
Tax History
| Year | Tax Paid | Tax Assessment Tax Assessment Total Assessment is a certain percentage of the fair market value that is determined by local assessors to be the total taxable value of land and additions on the property. | Land | Improvement |
|---|---|---|---|---|
| 2025 | $2,128 | $254,045 | -- | -- |
| 2024 | $1,975 | $262,350 | $0 | $0 |
| 2023 | $1,975 | $261,470 | $0 | $0 |
| 2022 | $1,955 | $250,030 | $0 | $0 |
| 2021 | $1,333 | $257,000 | $90,000 | $167,000 |
| 2020 | $1,354 | $257,000 | $90,000 | $167,000 |
| 2019 | $1,297 | $257,000 | $90,000 | $167,000 |
| 2018 | $1,410 | $263,400 | $90,000 | $173,400 |
| 2017 | $1,419 | $142,120 | $0 | $0 |
| 2016 | $1,222 | $113,190 | $0 | $0 |
| 2015 | $1,248 | $109,230 | $0 | $0 |
| 2014 | $1,145 | $99,275 | $0 | $0 |
Source: Public Records
Map
Nearby Homes
Your Personal Tour Guide
Ask me questions while you tour the home.