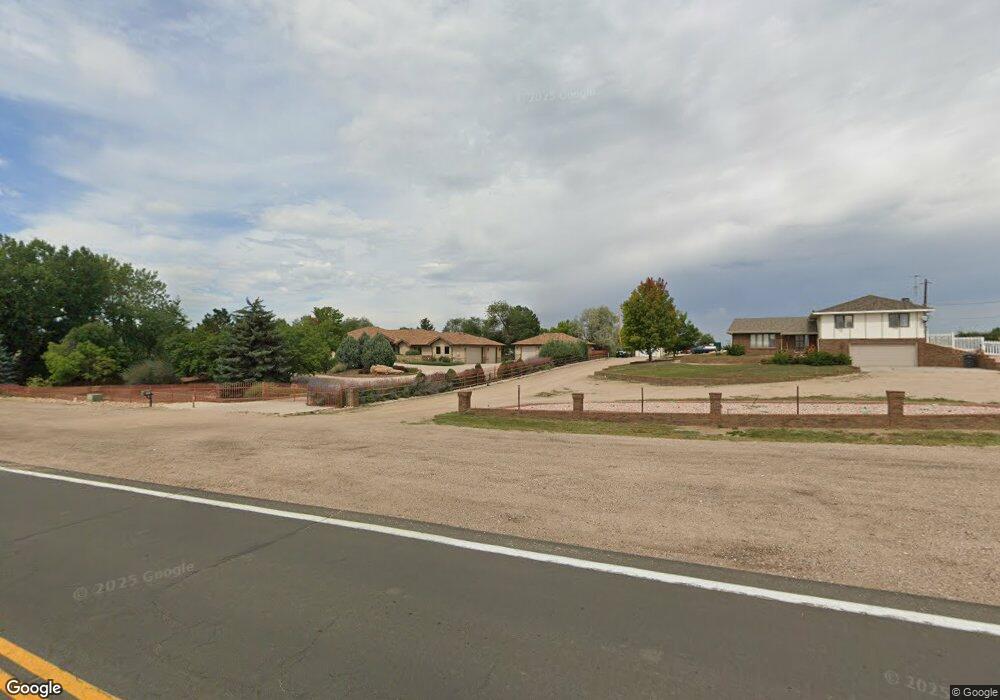
412 N 71st Ave Greeley, CO 80634
Estimated Value: $776,000 - $924,000
3
Beds
3
Baths
2,324
Sq Ft
$371/Sq Ft
Est. Value
About This Home
This home is located at 412 N 71st Ave, Greeley, CO 80634 and is currently estimated at $861,872, approximately $370 per square foot. 412 N 71st Ave is a home located in Weld County with nearby schools including Winograd K-8 Elementary School, Northridge High School, and West Ridge Academy Charter.
Ownership History
Date
Name
Owned For
Owner Type
Purchase Details
Closed on
Feb 16, 2007
Sold by
Leone John C and Leone Nancy W
Bought by
Sneesby Douglas A and Sneesby Laura G
Current Estimated Value
Home Financials for this Owner
Home Financials are based on the most recent Mortgage that was taken out on this home.
Original Mortgage
$324,000
Outstanding Balance
$189,653
Interest Rate
6.21%
Mortgage Type
Unknown
Estimated Equity
$672,219
Purchase Details
Closed on
Aug 8, 2006
Sold by
Bigbee Lois
Bought by
Leone John C and Leone Nancy W
Purchase Details
Closed on
Dec 27, 2002
Sold by
Ream Michael L and Ream Janet L
Bought by
Leone John C and Leone Nancy W
Purchase Details
Closed on
Jul 28, 1989
Sold by
Jacobs Nathan D and Jacobs Christine L
Bought by
Ream Michael L and Ream Janet L
Purchase Details
Closed on
May 16, 1986
Create a Home Valuation Report for This Property
The Home Valuation Report is an in-depth analysis detailing your home's value as well as a comparison with similar homes in the area
Purchase History
| Date | Buyer | Sale Price | Title Company |
|---|---|---|---|
| Sneesby Douglas A | $405,000 | Security Title | |
| Leone John C | -- | Security Title | |
| Leone John C | $430,000 | -- | |
| Ream Michael L | $147,800 | -- | |
| -- | -- | -- | |
| Jacobs Nathan D | $148,400 | -- |
Source: Public Records
Mortgage History
| Date | Status | Borrower | Loan Amount |
|---|---|---|---|
| Open | Sneesby Douglas A | $324,000 |
Source: Public Records
Tax History
| Year | Tax Paid | Tax Assessment Tax Assessment Total Assessment is a certain percentage of the fair market value that is determined by local assessors to be the total taxable value of land and additions on the property. | Land | Improvement |
|---|---|---|---|---|
| 2025 | $4,188 | $55,930 | $20,630 | $35,300 |
| 2024 | $3,993 | $53,060 | $19,860 | $33,200 |
| 2023 | $3,993 | $53,570 | $20,050 | $33,520 |
| 2022 | $3,849 | $44,140 | $17,650 | $26,490 |
| 2021 | $3,971 | $45,410 | $18,160 | $27,250 |
| 2020 | $3,630 | $41,640 | $17,680 | $23,960 |
| 2019 | $3,639 | $41,640 | $17,680 | $23,960 |
| 2018 | $3,489 | $42,130 | $15,220 | $26,910 |
| 2017 | $3,508 | $42,130 | $15,220 | $26,910 |
| 2016 | $3,005 | $40,610 | $12,070 | $28,540 |
| 2015 | $2,993 | $40,610 | $12,070 | $28,540 |
| 2014 | $2,332 | $30,870 | $11,030 | $19,840 |
Source: Public Records
Map
Nearby Homes
- 408 N 67th Ave
- 419 N Brisbane Ave
- 7204 Vallevue Dr
- 333 N 64th Ave
- 117 N 66th Ave
- 317 N 64th Ave
- 305 N 64th Ave
- 107 65th Ave
- 135 65th Ave
- 7142 W Canberra Street Dr
- 118 65th Ave
- 6911 W 3rd St Unit 920
- 6911 W 3rd St Unit 810
- 121 63rd Ave
- 7230 W Canberra Street Dr
- 6603 W 3rd St Unit 1620
- 6309 2nd St
- 6608 W 3rd St Unit 32-61
- 6302 2nd St
- 6119 B St
Your Personal Tour Guide
Ask me questions while you tour the home.