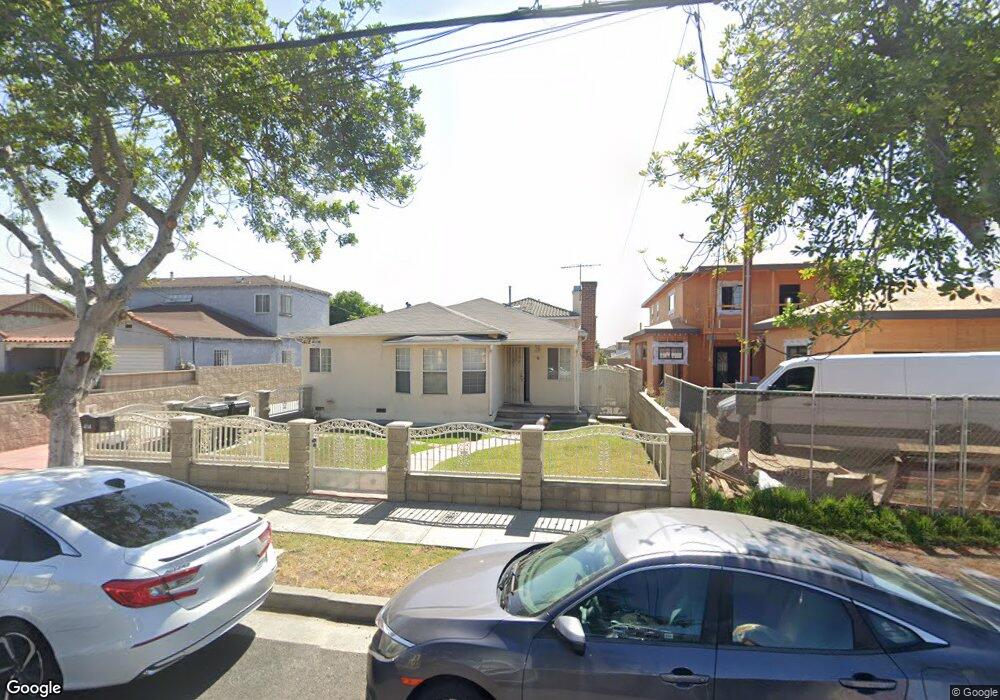
412 N Sierra Vista St Unit 2 Monterey Park, CA 91755
Estimated Value: $1,544,000 - $1,882,000
6
Beds
6
Baths
4,363
Sq Ft
$382/Sq Ft
Est. Value
About This Home
This home is located at 412 N Sierra Vista St Unit 2, Monterey Park, CA 91755 and is currently estimated at $1,664,690, approximately $381 per square foot. 412 N Sierra Vista St Unit 2 is a home located in Los Angeles County with nearby schools including Emerson (Ralph Waldo) Elementary School, Garvey (Richard) Intermediate School, and Mark Keppel High School.
Ownership History
Date
Name
Owned For
Owner Type
Purchase Details
Closed on
Sep 5, 2014
Sold by
Lau Mon Wah
Bought by
Lau Pak Fai Robert and Lau Mon Wah
Current Estimated Value
Home Financials for this Owner
Home Financials are based on the most recent Mortgage that was taken out on this home.
Original Mortgage
$335,000
Outstanding Balance
$255,895
Interest Rate
4.08%
Mortgage Type
New Conventional
Estimated Equity
$1,408,795
Purchase Details
Closed on
Aug 21, 2001
Sold by
Lau Pak Fai
Bought by
Lau Mon Wah
Home Financials for this Owner
Home Financials are based on the most recent Mortgage that was taken out on this home.
Original Mortgage
$180,000
Interest Rate
7.09%
Purchase Details
Closed on
Sep 20, 1993
Sold by
Martinez Elias and Martinez Gloria J
Bought by
Martinez Elias and Martinez Gloria J
Create a Home Valuation Report for This Property
The Home Valuation Report is an in-depth analysis detailing your home's value as well as a comparison with similar homes in the area
Home Values in the Area
Average Home Value in this Area
Purchase History
| Date | Buyer | Sale Price | Title Company |
|---|---|---|---|
| Lau Pak Fai Robert | -- | Nations Title Company | |
| Lau Mon Wah | -- | Fidelity National Title | |
| Lau Mon Wah | $260,000 | Fidelity National Title | |
| Martinez Elias | -- | -- |
Source: Public Records
Mortgage History
| Date | Status | Borrower | Loan Amount |
|---|---|---|---|
| Open | Lau Pak Fai Robert | $335,000 | |
| Closed | Lau Mon Wah | $180,000 |
Source: Public Records
Tax History Compared to Growth
Tax History
| Year | Tax Paid | Tax Assessment Tax Assessment Total Assessment is a certain percentage of the fair market value that is determined by local assessors to be the total taxable value of land and additions on the property. | Land | Improvement |
|---|---|---|---|---|
| 2025 | $11,712 | $843,648 | $265,903 | $577,745 |
| 2024 | $11,712 | $827,107 | $260,690 | $566,417 |
| 2023 | $11,330 | $810,890 | $255,579 | $555,311 |
| 2022 | $10,824 | $794,991 | $250,568 | $544,423 |
| 2021 | $10,757 | $779,404 | $245,655 | $533,749 |
| 2020 | $10,653 | $771,414 | $243,137 | $528,277 |
| 2019 | $10,360 | $756,289 | $238,370 | $517,919 |
| 2018 | $10,228 | $741,461 | $233,697 | $507,764 |
| 2016 | $9,395 | $712,671 | $224,623 | $488,048 |
| 2015 | $9,213 | $701,967 | $221,249 | $480,718 |
| 2014 | $9,092 | $688,218 | $216,916 | $471,302 |
Source: Public Records
Map
Nearby Homes
- 425 N Rural Dr
- 321 N Orange Ave Unit 103
- 321 N Orange Ave Unit 209
- 433 N Alhambra Ave Unit C
- 522 N Nicholson Ave Unit A
- 522 N Nicholson Ave Unit A
- 230 N Nicholson Ave Unit C
- 208 N Nicholson Ave Unit B
- 123 N Alhambra Ave Unit D
- 303 N Nicholson Ave Unit 308
- 303 N Nicholson Ave Unit 108
- 223 E Emerson Ave
- 117 Gladys Ave
- 829 Hershey Ave
- 112 S Sierra Vista St
- 205 N Nicholson Ave
- 203 N Nicholson Ave
- 208 N Lincoln Ave Unit 309
- 303 N Lincoln Ave Unit D
- 719 E Mabel Ave
- 412 N Sierra Vista St
- 416 N Sierra Vista St
- 410 N Sierra Vista St
- 406 N Sierra Vista St
- 422 N Sierra Vista St
- 511 E Emerson Ave
- 404 N Sierra Vista St
- 402 N Sierra Vista St
- 426 N Sierra Vista St
- 413 N Rural Dr Unit A
- 517 E Emerson Ave
- 409 N Rural Dr
- 417 N Rural Dr
- 417 N Rural Dr Unit B
- 421 N Rural Dr
- 405 N Rural Dr
- 425 N Rural Dr Unit A
- 429 E Emerson Ave
- 411 N Sierra Vista St
- 401 N Rural Dr