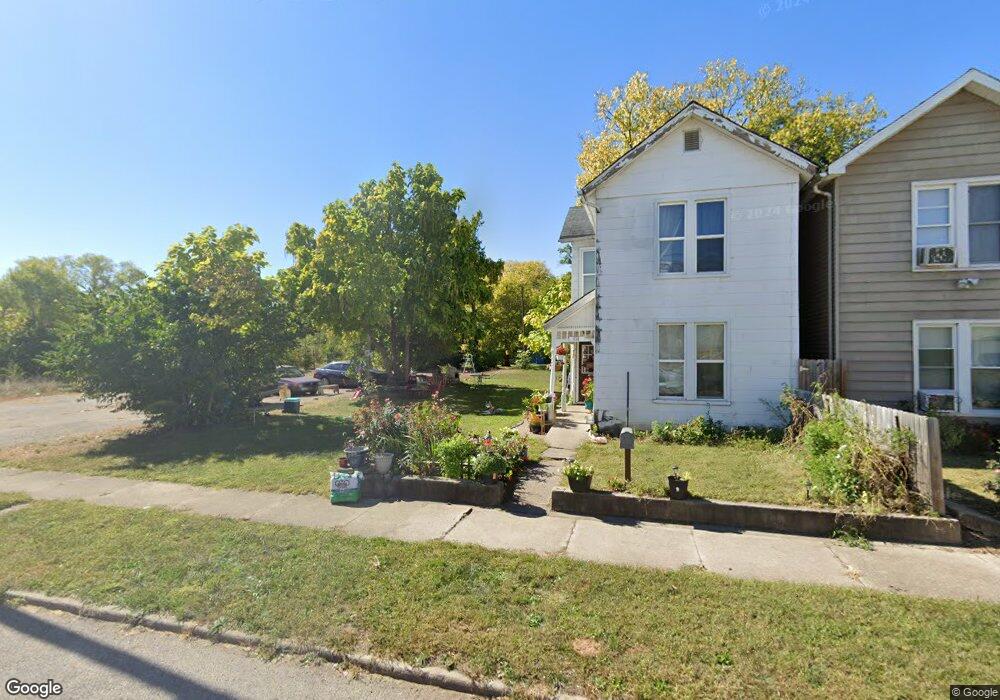
412 Park St Middletown, OH 45044
South Middletown NeighborhoodEstimated Value: $74,003 - $138,000
3
Beds
1
Bath
1,168
Sq Ft
$95/Sq Ft
Est. Value
About This Home
This home is located at 412 Park St, Middletown, OH 45044 and is currently estimated at $111,501, approximately $95 per square foot. 412 Park St is a home located in Butler County with nearby schools including Rosa Parks Elementary School, Highview 6th Grade Center, and Middletown Middle School.
Ownership History
Date
Name
Owned For
Owner Type
Purchase Details
Closed on
Dec 13, 2023
Sold by
Pariona Jonan and Pariona Elvira Galeana
Bought by
Perez Elvira Galeana
Current Estimated Value
Purchase Details
Closed on
Oct 16, 2019
Sold by
Tarr Angeldiane P and Tarr Angeldiane
Bought by
Pariona Jonan
Purchase Details
Closed on
Jul 29, 2019
Sold by
Estate Of Lamon Boyd Mcintosh
Bought by
Mcintosh Christopher K and Mcintosh Jeffrey P
Purchase Details
Closed on
Sep 11, 2018
Sold by
Mcintosh Hal
Bought by
Tarr Angeldiane
Purchase Details
Closed on
Aug 2, 2018
Sold by
Mcintosh Curtis
Bought by
Tarr Angeldiane
Purchase Details
Closed on
Jul 26, 2018
Sold by
Mcintosh Jeffrey P
Bought by
Tarr Angeldian E
Purchase Details
Closed on
Oct 10, 2015
Sold by
Mcintosh Lamon Boyd and Tarr Angeldine P
Bought by
Tarr Angeldiane P
Create a Home Valuation Report for This Property
The Home Valuation Report is an in-depth analysis detailing your home's value as well as a comparison with similar homes in the area
Home Values in the Area
Average Home Value in this Area
Purchase History
| Date | Buyer | Sale Price | Title Company |
|---|---|---|---|
| Perez Elvira Galeana | -- | None Listed On Document | |
| Pariona Jonan | $21,000 | None Available | |
| Mcintosh Christopher K | -- | None Available | |
| Tarr Angeldiane | -- | None Available | |
| Tarr Angeldiane | -- | None Available | |
| Tarr Angeldian E | -- | None Available | |
| Tarr Angeldiane | -- | None Available | |
| Tarr Angeldiane P | -- | None Available |
Source: Public Records
Tax History Compared to Growth
Tax History
| Year | Tax Paid | Tax Assessment Tax Assessment Total Assessment is a certain percentage of the fair market value that is determined by local assessors to be the total taxable value of land and additions on the property. | Land | Improvement |
|---|---|---|---|---|
| 2024 | $3,953 | $9,740 | $3,290 | $6,450 |
| 2023 | $534 | $12,670 | $3,290 | $9,380 |
| 2022 | $2,041 | $5,070 | $3,290 | $1,780 |
| 2021 | $318 | $5,070 | $3,290 | $1,780 |
| 2020 | $330 | $5,070 | $3,290 | $1,780 |
| 2019 | $526 | $7,260 | $3,150 | $4,110 |
| 2018 | $505 | $7,260 | $3,150 | $4,110 |
| 2017 | $471 | $7,260 | $3,150 | $4,110 |
| 2016 | $471 | $6,440 | $3,150 | $3,290 |
| 2015 | $464 | $6,440 | $3,150 | $3,290 |
| 2014 | $678 | $6,440 | $3,150 | $3,290 |
| 2013 | $678 | $10,470 | $3,150 | $7,320 |
Source: Public Records
Map
Nearby Homes
- 410 Park St
- 408 Park St
- 406 Park St
- 400 Park St
- 1111 Liberty St
- 318 Park St
- 321 Vanderveer St
- 317 Vanderveer St
- 334 Vanderveer St
- 1114 Girard Ave
- 304 Park St
- 332 Vanderveer St
- 330 Vanderveer St
- 328 Vanderveer St
- 324 Vanderveer St
- 326 Vanderveer St
- 1104 Girard Ave
- 303 Vanderveer St
- 320 Vanderveer St
- 301 Vanderveer St