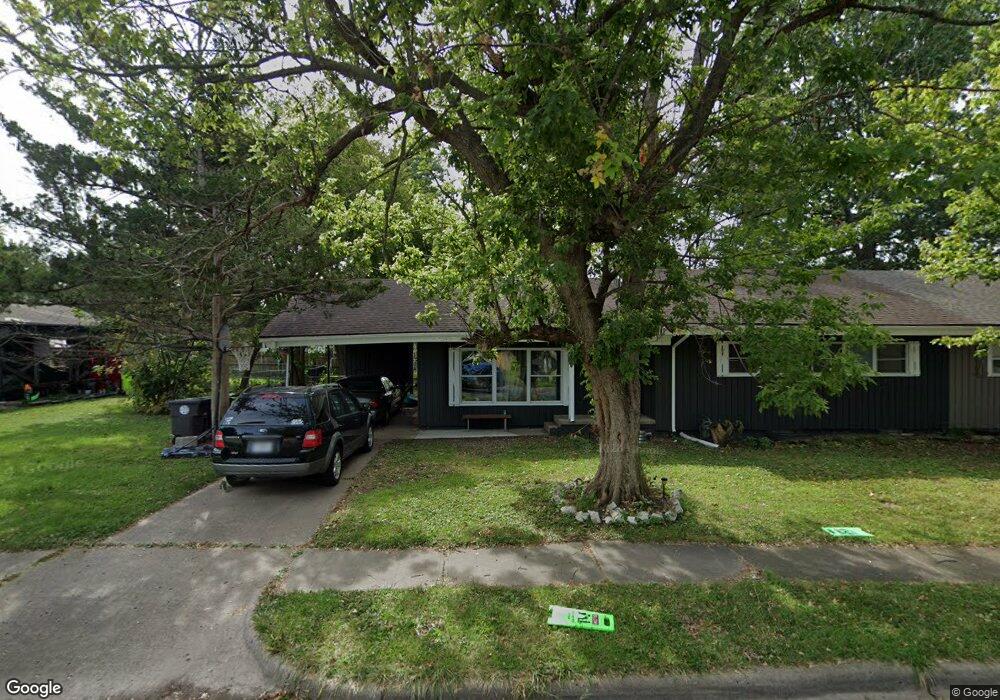
412 Whisper Ln Belton, MO 64012
Estimated Value: $175,000 - $204,000
3
Beds
1
Bath
1,200
Sq Ft
$154/Sq Ft
Est. Value
About This Home
This home is located at 412 Whisper Ln, Belton, MO 64012 and is currently estimated at $184,959, approximately $154 per square foot. 412 Whisper Ln is a home located in Cass County with nearby schools including Gladden Elementary School, Mill Creek Upper Elementary School, and Belton Middle School.
Ownership History
Date
Name
Owned For
Owner Type
Purchase Details
Closed on
Jan 14, 2019
Sold by
Morrison Lauren Nekoe
Bought by
Morrison John
Current Estimated Value
Home Financials for this Owner
Home Financials are based on the most recent Mortgage that was taken out on this home.
Original Mortgage
$78,750
Outstanding Balance
$69,245
Interest Rate
4.8%
Mortgage Type
New Conventional
Estimated Equity
$115,714
Purchase Details
Closed on
Jul 19, 2006
Sold by
Dalton Dennis R and Dalton Debra D
Bought by
Morrison John
Home Financials for this Owner
Home Financials are based on the most recent Mortgage that was taken out on this home.
Original Mortgage
$9,531
Interest Rate
6.6%
Mortgage Type
New Conventional
Purchase Details
Closed on
Mar 31, 2006
Sold by
Secretary Fo Hud
Bought by
Dalton Dennis R and Dalton Debra D
Purchase Details
Closed on
Sep 7, 2005
Sold by
National City Mortgage Inc
Bought by
Secretary Of Hud
Purchase Details
Closed on
May 24, 2005
Sold by
Mckinney Shawn A and Mckinney Jennifer D
Bought by
National City Mortgage Co
Create a Home Valuation Report for This Property
The Home Valuation Report is an in-depth analysis detailing your home's value as well as a comparison with similar homes in the area
Home Values in the Area
Average Home Value in this Area
Purchase History
We collect this data history from publicly available records. To have your information removed, we recommend requesting removal directly through your county’s website.
| Date | Buyer | Sale Price | Title Company |
|---|---|---|---|
| Morrison John | -- | None Available | |
| Morrison John | -- | -- | |
| Dalton Dennis R | -- | -- | |
| Secretary Of Hud | -- | -- | |
| National City Mortgage Co | $64,674 | -- |
Source: Public Records
Mortgage History
We collect this data history from publicly available records. To have your information removed, we recommend requesting removal directly through your county’s website.
| Date | Status | Borrower | Loan Amount |
|---|---|---|---|
| Open | Morrison John | $78,750 | |
| Closed | Morrison John | $9,531 |
Source: Public Records
Tax History
| Year | Tax Paid | Tax Assessment Tax Assessment Total Assessment is a certain percentage of the fair market value that is determined by local assessors to be the total taxable value of land and additions on the property. | Land | Improvement |
|---|---|---|---|---|
| 2025 | $1,405 | $19,350 | $1,780 | $17,570 |
| 2024 | $1,405 | $17,040 | $1,620 | $15,420 |
| 2023 | $1,401 | $17,040 | $1,620 | $15,420 |
| 2022 | $1,273 | $15,340 | $1,620 | $13,720 |
| 2021 | $1,273 | $15,340 | $1,620 | $13,720 |
| 2020 | $1,238 | $14,830 | $1,620 | $13,210 |
| 2019 | $1,212 | $14,830 | $1,620 | $13,210 |
| 2018 | $1,051 | $12,970 | $1,290 | $11,680 |
| 2017 | $1,004 | $12,970 | $1,290 | $11,680 |
| 2016 | $1,004 | $12,320 | $1,290 | $11,030 |
| 2015 | $1,004 | $12,320 | $1,290 | $11,030 |
| 2014 | $1,007 | $12,320 | $1,290 | $11,030 |
| 2013 | -- | $12,320 | $1,290 | $11,030 |
Source: Public Records
Map
Nearby Homes
- 409 Corral Dr
- 507 Ranchero Place
- 600 N Park Dr
- 508 Corral Dr
- 405 N Cleveland Ave
- 210 Myron Ave
- 528 Mark Ln
- 316 Hawthorne Dr
- 814 Belton Ave
- 115 Redbud Ln
- 511 W North Ave
- 401 N Scott Ave
- 104 London Way
- 910 Sherman Pkwy
- 503 Dover Ct
- 301 N Scott Ave
- 205 Dawn Ave
- 209 Dawn Ave
- 212 N Oak Dr
- 000 S Side Aspen St
Your Personal Tour Guide
Ask me questions while you tour the home.