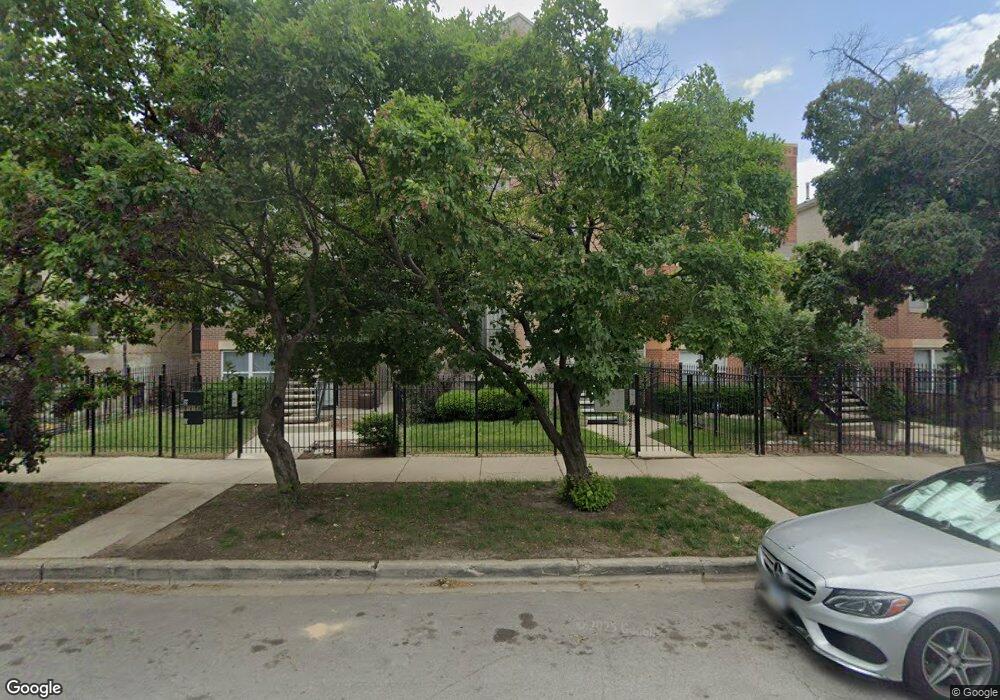
4121 S Vincennes Ave Unit 1 Chicago, IL 60653
Grand Boulevard NeighborhoodEstimated Value: $338,000 - $477,714
4
Beds
3
Baths
2,700
Sq Ft
$156/Sq Ft
Est. Value
About This Home
This home is located at 4121 S Vincennes Ave Unit 1, Chicago, IL 60653 and is currently estimated at $420,429, approximately $155 per square foot. 4121 S Vincennes Ave Unit 1 is a home located in Cook County with nearby schools including Fuller Elementary School, UChicago Charter Carter G. Woodson Campus, and Holy Angels Catholic School.
Ownership History
Date
Name
Owned For
Owner Type
Purchase Details
Closed on
Oct 9, 2017
Sold by
Chicago Patrolmen S Fcu
Bought by
Britton James L
Current Estimated Value
Home Financials for this Owner
Home Financials are based on the most recent Mortgage that was taken out on this home.
Original Mortgage
$208,550
Outstanding Balance
$176,168
Interest Rate
4.25%
Mortgage Type
New Conventional
Estimated Equity
$244,261
Purchase Details
Closed on
Mar 31, 2017
Sold by
Buford Randall
Bought by
Chicago Patrolmens Federal Cu
Purchase Details
Closed on
Jun 13, 2005
Sold by
Prairie Bank & Trust Co
Bought by
Buford Randall
Home Financials for this Owner
Home Financials are based on the most recent Mortgage that was taken out on this home.
Original Mortgage
$3,000
Interest Rate
5.68%
Mortgage Type
Unknown
Create a Home Valuation Report for This Property
The Home Valuation Report is an in-depth analysis detailing your home's value as well as a comparison with similar homes in the area
Home Values in the Area
Average Home Value in this Area
Purchase History
| Date | Buyer | Sale Price | Title Company |
|---|---|---|---|
| Britton James L | $215,000 | Fidelity National Title | |
| Chicago Patrolmens Federal Cu | -- | Premier Title | |
| Buford Randall | $279,000 | Git |
Source: Public Records
Mortgage History
| Date | Status | Borrower | Loan Amount |
|---|---|---|---|
| Open | Britton James L | $208,550 | |
| Previous Owner | Buford Randall | $3,000 |
Source: Public Records
Tax History Compared to Growth
Tax History
| Year | Tax Paid | Tax Assessment Tax Assessment Total Assessment is a certain percentage of the fair market value that is determined by local assessors to be the total taxable value of land and additions on the property. | Land | Improvement |
|---|---|---|---|---|
| 2024 | $7,553 | $41,895 | $5,504 | $36,391 |
| 2023 | $7,341 | $39,000 | $5,504 | $33,496 |
| 2022 | $7,341 | $39,000 | $5,504 | $33,496 |
| 2021 | $7,866 | $38,998 | $5,503 | $33,495 |
| 2020 | $5,673 | $25,467 | $2,673 | $22,794 |
| 2019 | $5,642 | $28,080 | $2,673 | $25,407 |
| 2018 | $5,547 | $28,080 | $2,673 | $25,407 |
| 2017 | $4,628 | $21,500 | $2,201 | $19,299 |
| 2016 | $5,940 | $29,658 | $2,201 | $27,457 |
| 2015 | $5,435 | $29,658 | $2,201 | $27,457 |
| 2014 | $4,476 | $26,695 | $1,886 | $24,809 |
| 2013 | $4,377 | $26,695 | $1,886 | $24,809 |
Source: Public Records
Map
Nearby Homes
- 450 E Bowen Ave Unit 2W
- 450 E Bowen Ave Unit 1E
- 633 E Bowen Ave Unit 1E
- 4242 S Vincennes Ave Unit 2
- 702 E 41st St
- 4220 S Champlain Ave Unit 2N
- 656 E Bowen Ave
- 4141 S Langley Ave
- 4058 S King Dr
- 4243 S King Dr
- 512 E Oakwood Blvd Unit 2
- 713 E Bowen Ave
- 4028 S King Dr
- 346 E 41st St Unit 2
- 4244 S Langley Ave
- 421 E 43rd St
- 4055 S Calumet Ave Unit 3
- 131 E 43rd St
- 641-645 E 43rd St
- 4343 S Forrestville Ave
- 4121 S Vincennes Ave Unit 2
- 4121 S Vincennes Ave Unit 3
- 4123 S Vincennes Ave
- 4117 S Vincennes Ave
- 4115 S Vincennes Ave
- 4113 S Vincennes Ave
- 4125 S Vincennes Ave
- 4125 S Vincennes Ave Unit 1
- 516 E Bowen Ave
- 4109 S Vincennes Ave
- 518 E Bowen Ave
- 4107 S Vincennes Ave
- 520 E Bowen Ave Unit 1
- 4105 S Vincennes Ave
- 4103 S Vincennes Ave
- 4114 S Vincennes Ave Unit 3N
- 4114 S Vincennes Ave Unit 3S
- 4114 S Vincennes Ave Unit 2N
- 4114 S Vincennes Ave Unit 1N
- 4114 S Vincennes Ave Unit 2S