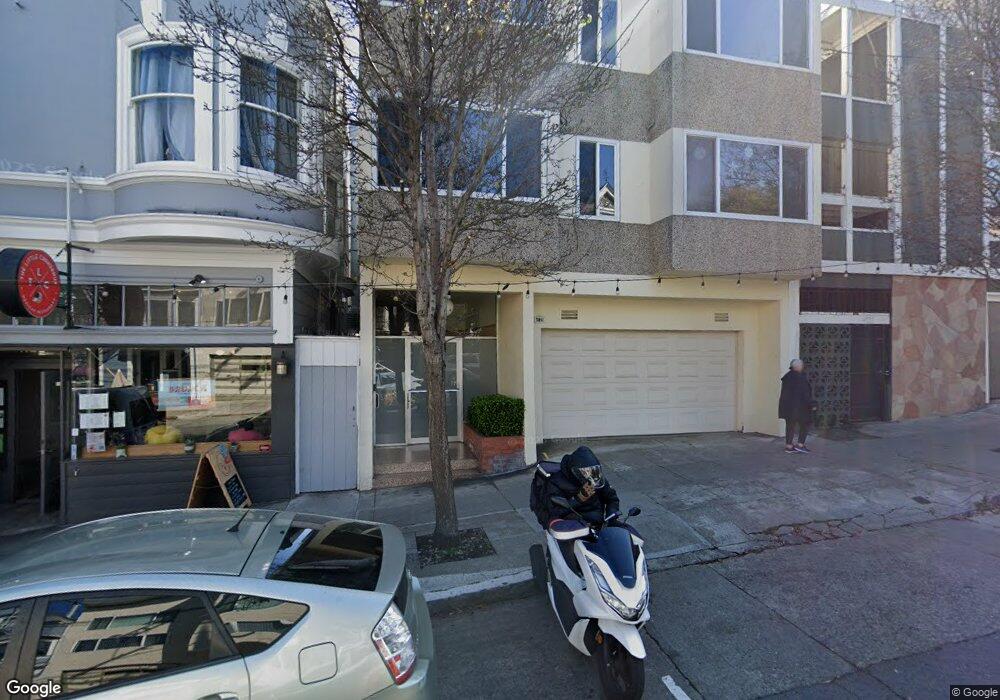
4125 24th St Unit 4 San Francisco, CA 94114
Noe Valley NeighborhoodEstimated Value: $864,322 - $1,263,000
2
Beds
1
Bath
756
Sq Ft
$1,310/Sq Ft
Est. Value
About This Home
This home is located at 4125 24th St Unit 4, San Francisco, CA 94114 and is currently estimated at $990,331, approximately $1,309 per square foot. 4125 24th St Unit 4 is a home located in San Francisco County with nearby schools including Alvarado Elementary, James Lick Middle School, and St. Philip School.
Ownership History
Date
Name
Owned For
Owner Type
Purchase Details
Closed on
Mar 20, 2019
Sold by
Iantuono Nicole
Bought by
Iantuono Nicole M and The Nicole M Iantuono Family T
Current Estimated Value
Purchase Details
Closed on
Jun 8, 2010
Sold by
Ranson Timothy James
Bought by
Iantuono Nicole
Home Financials for this Owner
Home Financials are based on the most recent Mortgage that was taken out on this home.
Original Mortgage
$417,000
Outstanding Balance
$278,650
Interest Rate
4.91%
Mortgage Type
New Conventional
Estimated Equity
$711,681
Purchase Details
Closed on
Oct 13, 2005
Sold by
Torok Bradley and Torok Kelly
Bought by
Ranson Timothy James
Home Financials for this Owner
Home Financials are based on the most recent Mortgage that was taken out on this home.
Original Mortgage
$1,612,771
Interest Rate
6%
Mortgage Type
Purchase Money Mortgage
Create a Home Valuation Report for This Property
The Home Valuation Report is an in-depth analysis detailing your home's value as well as a comparison with similar homes in the area
Home Values in the Area
Average Home Value in this Area
Purchase History
| Date | Buyer | Sale Price | Title Company |
|---|---|---|---|
| Iantuono Nicole M | -- | None Available | |
| Iantuono Nicole | $625,000 | Old Republic Title Company | |
| Ranson Timothy James | -- | Old Republic Title Company | |
| Ranson Timothy James | $575,000 | Chicago Title Company |
Source: Public Records
Mortgage History
| Date | Status | Borrower | Loan Amount |
|---|---|---|---|
| Open | Iantuono Nicole | $417,000 | |
| Previous Owner | Ranson Timothy James | $1,612,771 |
Source: Public Records
Tax History Compared to Growth
Tax History
| Year | Tax Paid | Tax Assessment Tax Assessment Total Assessment is a certain percentage of the fair market value that is determined by local assessors to be the total taxable value of land and additions on the property. | Land | Improvement |
|---|---|---|---|---|
| 2025 | $10,265 | $806,749 | $484,052 | $322,697 |
| 2024 | $10,265 | $790,931 | $474,561 | $316,370 |
| 2023 | $10,108 | $775,423 | $465,256 | $310,167 |
| 2022 | $9,911 | $760,220 | $456,134 | $304,086 |
| 2021 | $9,723 | $745,315 | $447,191 | $298,124 |
| 2020 | $9,776 | $737,674 | $442,606 | $295,068 |
| 2019 | $9,395 | $723,211 | $433,928 | $289,283 |
| 2018 | $9,086 | $709,031 | $425,420 | $283,611 |
| 2017 | $8,682 | $695,129 | $417,079 | $278,050 |
| 2016 | $8,529 | $681,500 | $408,901 | $272,599 |
| 2015 | $8,435 | $671,264 | $402,759 | $268,505 |
| 2014 | $8,213 | $658,116 | $394,870 | $263,246 |
Source: Public Records
Map
Nearby Homes
- 734 Elizabeth St
- 833 Douglass St
- 729 Douglass St
- 729 Douglass St Unit A
- 4258 26th St
- 4149 26th St
- 222 Jersey St
- 1040 Sanchez St
- 4335 Cesar Chavez St
- 584 Douglass St
- 464 Hoffman Ave
- 38 Newburg St
- 938 Sanchez St
- 3879 23rd St
- 417-419 Eureka St
- 228 Vicksburg St Unit 3
- 4229 21st St
- 4040 Cesar Chavez
- 930 Elizabeth St Unit 1
- 4047 Cesar Chavez St
- 4125 24th St Unit 1
- 4125 24th St
- 4125 24th St Unit 2
- 4125 24th St
- 4123 24th St
- 4119 24th St Unit 4123
- 4109 24th St Unit 4111
- 4139 24th St Unit 4141
- 4143 24th St
- 4147 24th St
- 1320 Castro St
- 4110 24th St
- 412 Jersey St
- 416 Jersey St
- 410 Jersey St
- 418 Jersey St
- 1328 Castro St
- 1326 Castro St Unit 1326
- 408 Jersey St
- 1330 Castro St