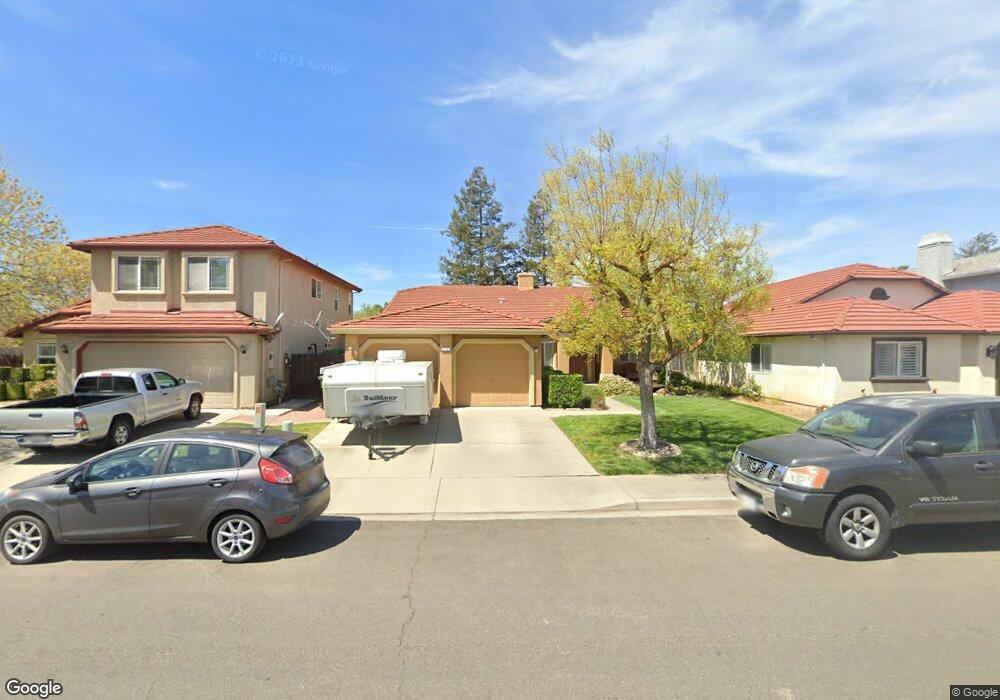
4125 Donovan Way Turlock, CA 95382
Estimated Value: $476,624 - $519,000
3
Beds
2
Baths
1,688
Sq Ft
$296/Sq Ft
Est. Value
About This Home
This home is located at 4125 Donovan Way, Turlock, CA 95382 and is currently estimated at $498,906, approximately $295 per square foot. 4125 Donovan Way is a home located in Stanislaus County with nearby schools including Sandra Tovar Medeiros Elementary School, Turlock Junior High School, and Marvin A. Dutcher Middle School.
Ownership History
Date
Name
Owned For
Owner Type
Purchase Details
Closed on
Mar 10, 2025
Sold by
Sylvester Steven W and Sylvester Elisabeth A
Bought by
Sylvester Family 2025 Trust and Sylvester
Current Estimated Value
Purchase Details
Closed on
Jul 25, 2001
Sold by
Watson Edward Wade and Watson Jennifer M
Bought by
Sylvester Steven W and Sylvester Elisabeth A
Home Financials for this Owner
Home Financials are based on the most recent Mortgage that was taken out on this home.
Original Mortgage
$127,000
Interest Rate
7.1%
Purchase Details
Closed on
May 6, 1997
Sold by
Anthony Donovan Inc
Bought by
Watson Edward Wade and Watson Jennifer M
Home Financials for this Owner
Home Financials are based on the most recent Mortgage that was taken out on this home.
Original Mortgage
$137,710
Interest Rate
8.08%
Mortgage Type
FHA
Create a Home Valuation Report for This Property
The Home Valuation Report is an in-depth analysis detailing your home's value as well as a comparison with similar homes in the area
Purchase History
| Date | Buyer | Sale Price | Title Company |
|---|---|---|---|
| Sylvester Family 2025 Trust | -- | None Listed On Document | |
| Sylvester Steven W | $197,000 | North American Title Co | |
| Watson Edward Wade | $140,000 | North American Title |
Source: Public Records
Mortgage History
| Date | Status | Borrower | Loan Amount |
|---|---|---|---|
| Previous Owner | Sylvester Steven W | $127,000 | |
| Previous Owner | Watson Edward Wade | $137,710 |
Source: Public Records
Tax History
| Year | Tax Paid | Tax Assessment Tax Assessment Total Assessment is a certain percentage of the fair market value that is determined by local assessors to be the total taxable value of land and additions on the property. | Land | Improvement |
|---|---|---|---|---|
| 2025 | $3,202 | $293,220 | $55,387 | $237,833 |
| 2024 | $3,143 | $287,471 | $54,301 | $233,170 |
| 2023 | $3,137 | $281,836 | $53,237 | $228,599 |
| 2022 | $3,097 | $276,311 | $52,194 | $224,117 |
| 2021 | $3,052 | $270,894 | $51,171 | $219,723 |
| 2020 | $3,031 | $268,118 | $50,647 | $217,471 |
| 2019 | $2,981 | $262,861 | $49,654 | $213,207 |
| 2018 | $2,977 | $257,708 | $48,681 | $209,027 |
| 2017 | $2,909 | $252,656 | $47,727 | $204,929 |
| 2016 | $2,724 | $247,703 | $46,792 | $200,911 |
| 2015 | $2,701 | $243,984 | $46,090 | $197,894 |
| 2014 | $2,674 | $239,206 | $45,188 | $194,018 |
Source: Public Records
Map
Nearby Homes
- 4184 Horizon Ct
- 4246 Merchant Ln
- 4185 Pathway Ln
- 1232 Paseo Belleza
- 1360 Shady Ln Unit 923
- 1360 Shady Ln Unit 1022
- 4666 Treasure Ct
- 1901 Geer Rd
- 1894 Greenfield Dr
- 225 Fullerton Dr
- 3148 Andre Ln
- 3178 Andre Ln
- 805 Cole Ave
- 4500 Fosberg Rd
- 2394 Tea Rose St
- 3350 Spring Garden Dr
- 4213 Montara Dr
- 2905 Niagra St Unit 257
- 2900 Andre Ln Unit 241
- 2700 Oxford Ave
- 4135 Donovan Way
- 4115 Donovan Way
- 4145 Donovan Way
- 4116 Piro Ct
- 4106 Piro Ct
- 4126 Piro Ct
- 4130 Donovan Way
- 4155 Donovan Way
- 4120 Donovan Way
- 4140 Donovan Way
- 4146 Piro Ct
- 4110 Donovan Way
- 4150 Donovan Way
- 900 Collegeview Dr
- 910 Collegeview Dr
- 4165 Donovan Way
- 920 Collegeview Dr
- 4100 Donovan Way
- 4166 Piro Ct
- 940 Collegeview Dr
Your Personal Tour Guide
Ask me questions while you tour the home.