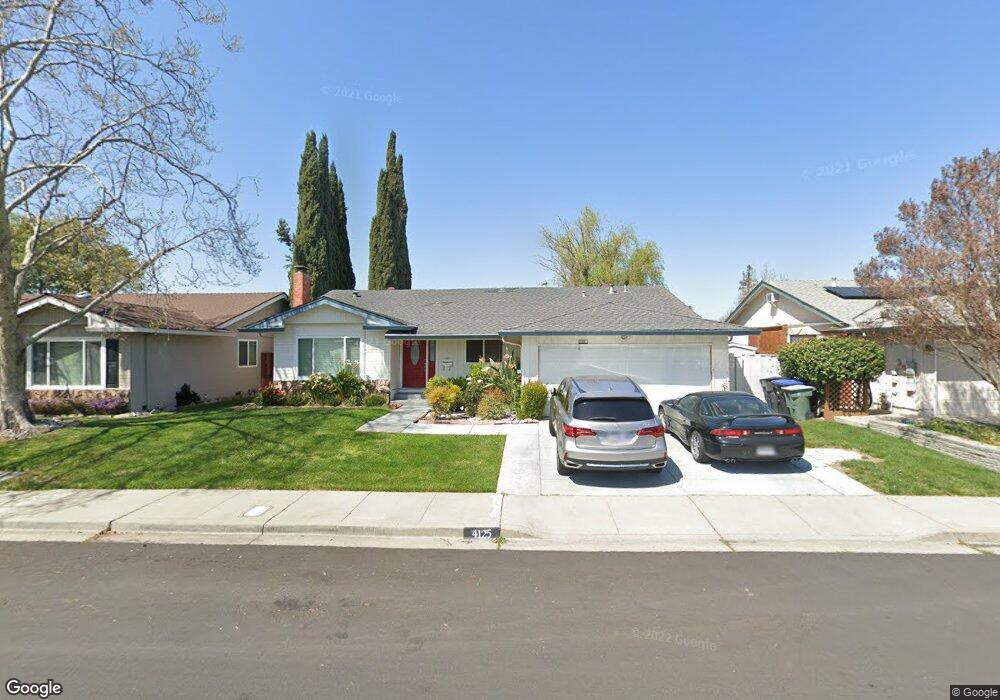
4125 Holland Dr Unit 6 Pleasanton, CA 94588
Stoneridge NeighborhoodEstimated Value: $1,428,102 - $1,503,000
4
Beds
2
Baths
1,816
Sq Ft
$812/Sq Ft
Est. Value
About This Home
This home is located at 4125 Holland Dr Unit 6, Pleasanton, CA 94588 and is currently estimated at $1,473,776, approximately $811 per square foot. 4125 Holland Dr Unit 6 is a home located in Alameda County with nearby schools including Donlon Elementary School, Thomas S. Hart Middle School, and Foothill High School.
Ownership History
Date
Name
Owned For
Owner Type
Purchase Details
Closed on
Aug 17, 2020
Sold by
Kesavan Ramkumar and Chi Lena H
Bought by
Kesavan Ramkumar and Chi Lena H
Current Estimated Value
Home Financials for this Owner
Home Financials are based on the most recent Mortgage that was taken out on this home.
Original Mortgage
$390,000
Outstanding Balance
$345,957
Interest Rate
3%
Mortgage Type
New Conventional
Estimated Equity
$1,127,819
Purchase Details
Closed on
Nov 17, 2010
Sold by
Goett David P and Goett Farideh
Bought by
Kesavan Ram and Chi Lena H
Home Financials for this Owner
Home Financials are based on the most recent Mortgage that was taken out on this home.
Original Mortgage
$468,000
Interest Rate
4.16%
Mortgage Type
New Conventional
Create a Home Valuation Report for This Property
The Home Valuation Report is an in-depth analysis detailing your home's value as well as a comparison with similar homes in the area
Home Values in the Area
Average Home Value in this Area
Purchase History
| Date | Buyer | Sale Price | Title Company |
|---|---|---|---|
| Kesavan Ramkumar | -- | Chicago Title Company | |
| Kesavan Ram | $585,000 | Fidelity National Title Co |
Source: Public Records
Mortgage History
| Date | Status | Borrower | Loan Amount |
|---|---|---|---|
| Open | Kesavan Ramkumar | $390,000 | |
| Previous Owner | Kesavan Ram | $468,000 |
Source: Public Records
Tax History Compared to Growth
Tax History
| Year | Tax Paid | Tax Assessment Tax Assessment Total Assessment is a certain percentage of the fair market value that is determined by local assessors to be the total taxable value of land and additions on the property. | Land | Improvement |
|---|---|---|---|---|
| 2025 | $8,686 | $749,443 | $224,833 | $524,610 |
| 2024 | $8,686 | $734,753 | $220,426 | $514,327 |
| 2023 | $8,587 | $720,351 | $216,105 | $504,246 |
| 2022 | $8,136 | $706,228 | $211,868 | $494,360 |
| 2021 | $7,927 | $692,381 | $207,714 | $484,667 |
| 2020 | $7,827 | $685,285 | $205,585 | $479,700 |
| 2019 | $7,922 | $671,854 | $201,556 | $470,298 |
| 2018 | $7,762 | $658,685 | $197,605 | $461,080 |
| 2017 | $7,565 | $645,774 | $193,732 | $452,042 |
| 2016 | $6,983 | $633,115 | $189,934 | $443,181 |
| 2015 | $6,854 | $623,610 | $187,083 | $436,527 |
| 2014 | $6,976 | $611,394 | $183,418 | $427,976 |
Source: Public Records
Map
Nearby Homes
- 3702 Gettysburg Ct N
- 6355 Singletree Way
- 4421 Muirwood Dr
- 4336 Muirwood Dr
- 4504 Muirwood Dr
- 3530 Carlsbad Ct
- 4205 Dorman Rd
- 7444 Pecan Ct
- 7606 Desertwood Ln
- 3636 Shenandoah Ct
- 6852 Massey Ct
- 7758 Forsythia Ct
- 6289 Garner Ct
- 3162 Paseo Robles
- 6137 Inglewood Dr
- 3110 Paseo Robles
- 5988 Corte Cerritos
- 6342 Alvord Way
- 6450 Calle Esperanza
- 6056 Corte Encinas