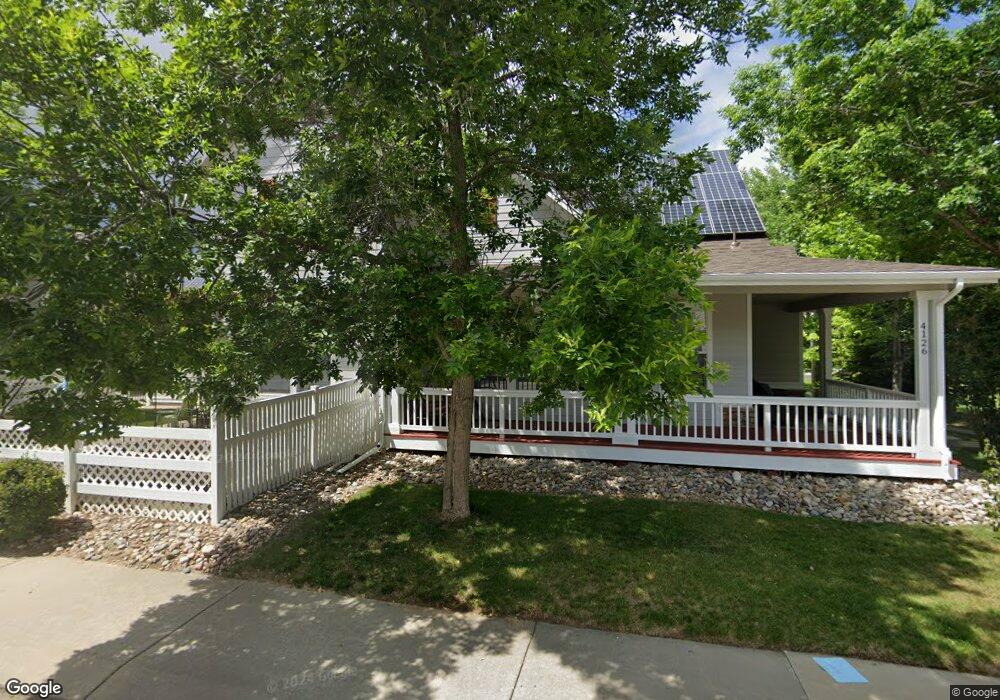
4126 Ravenna Place Longmont, CO 80503
Upper Clover Basin NeighborhoodEstimated Value: $754,000 - $880,000
5
Beds
4
Baths
3,559
Sq Ft
$228/Sq Ft
Est. Value
About This Home
This home is located at 4126 Ravenna Place, Longmont, CO 80503 and is currently estimated at $812,241, approximately $228 per square foot. 4126 Ravenna Place is a home located in Boulder County with nearby schools including Eagle Crest Elementary School, Altona Middle School, and Silver Creek High School.
Ownership History
Date
Name
Owned For
Owner Type
Purchase Details
Closed on
Jan 13, 2012
Sold by
The Eric M Hirman Living Trust
Bought by
Miller Pamela C
Current Estimated Value
Home Financials for this Owner
Home Financials are based on the most recent Mortgage that was taken out on this home.
Original Mortgage
$280,000
Outstanding Balance
$32,296
Interest Rate
4.04%
Mortgage Type
New Conventional
Estimated Equity
$779,945
Purchase Details
Closed on
Jul 11, 2007
Sold by
Hirman Eric M
Bought by
The Eric M Hirman Living Trust
Purchase Details
Closed on
Jun 10, 2005
Sold by
Cph Longmont Llc
Bought by
Hirman Eric M
Home Financials for this Owner
Home Financials are based on the most recent Mortgage that was taken out on this home.
Original Mortgage
$267,250
Interest Rate
5.78%
Mortgage Type
Fannie Mae Freddie Mac
Create a Home Valuation Report for This Property
The Home Valuation Report is an in-depth analysis detailing your home's value as well as a comparison with similar homes in the area
Home Values in the Area
Average Home Value in this Area
Purchase History
| Date | Buyer | Sale Price | Title Company |
|---|---|---|---|
| Miller Pamela C | $365,000 | Land Title Guarantee Company | |
| The Eric M Hirman Living Trust | -- | None Available | |
| Hirman Eric M | $334,123 | Land Title Guarantee Company |
Source: Public Records
Mortgage History
| Date | Status | Borrower | Loan Amount |
|---|---|---|---|
| Open | Miller Pamela C | $280,000 | |
| Previous Owner | Hirman Eric M | $267,250 |
Source: Public Records
Tax History Compared to Growth
Tax History
| Year | Tax Paid | Tax Assessment Tax Assessment Total Assessment is a certain percentage of the fair market value that is determined by local assessors to be the total taxable value of land and additions on the property. | Land | Improvement |
|---|---|---|---|---|
| 2025 | $4,951 | $52,619 | $9,331 | $43,288 |
| 2024 | $4,951 | $52,619 | $9,331 | $43,288 |
| 2023 | $4,883 | $51,758 | $9,883 | $45,560 |
| 2022 | $4,175 | $42,186 | $7,443 | $34,743 |
| 2021 | $4,229 | $43,401 | $7,658 | $35,743 |
| 2020 | $4,033 | $41,513 | $6,936 | $34,577 |
| 2019 | $3,969 | $41,513 | $6,936 | $34,577 |
| 2018 | $3,312 | $34,870 | $6,120 | $28,750 |
| 2017 | $3,267 | $38,550 | $6,766 | $31,784 |
| 2016 | $3,277 | $34,284 | $8,119 | $26,165 |
| 2015 | $3,123 | $28,162 | $6,527 | $21,635 |
| 2014 | $2,630 | $28,162 | $6,527 | $21,635 |
Source: Public Records
Map
Nearby Homes
- 4240 Riley Dr
- 1601 Venice Ln
- 4522 Portofino Dr
- 1580 Venice Ln
- 1663 Venice Ln
- 4532 Heatherhill Ct
- 8584 Summerlin Place
- 1906 Wildrose Dr
- 1923 High Plains Dr
- 3617 Sunflower Cir
- 906 Cranberry Ct
- 1822 Redtop Ct
- 913 Ninebark Ln
- 5120 Heatherhill St
- 5025 Eagan Cir
- 1901 Fountain Ct
- 2286 Star Hill St
- 1004 Chokecherry Ln
- 2316 Star Hill St
- 841 Robert St
- 4130 Ravenna Place
- 4204 Ravenna Place
- 4134 Ravenna Place
- 4127 Ravenna Place
- 4201 Ravenna Place
- 4208 Ravenna Place
- 4123 Ravenna Place
- 4201 Arezzo Dr
- 4205 Ravenna Place
- 4209 Ravenna Place
- 4205 Arezzo Dr
- 4212 Ravenna Place
- 4115 Ravenna Place
- 4213 Ravenna Place
- 4209 Arezzo Dr
- 4138 Arezzo Dr
- 4111 Ravenna Place
- 4216 Ravenna Place
- 4217 Ravenna Place
- 4102 Ravenna Place