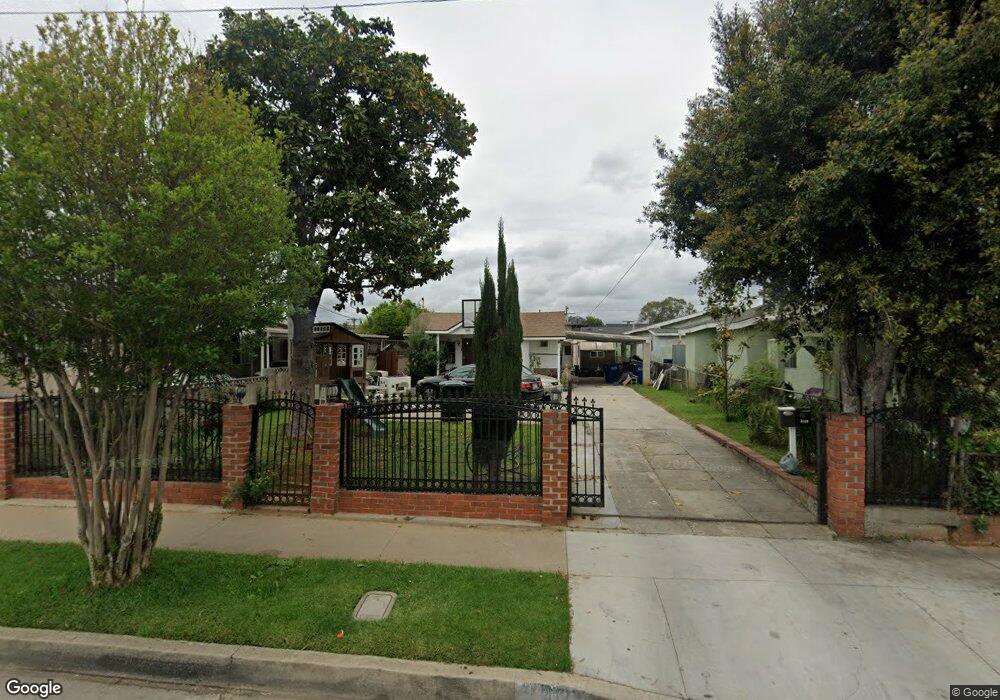
4127 Gleason St Los Angeles, CA 90063
Estimated Value: $694,000 - $862,000
3
Beds
2
Baths
1,272
Sq Ft
$582/Sq Ft
Est. Value
About This Home
This home is located at 4127 Gleason St, Los Angeles, CA 90063 and is currently estimated at $740,576, approximately $582 per square foot. 4127 Gleason St is a home located in Los Angeles County with nearby schools including Marianna Avenue Elementary School, Belvedere Middle School, and Engineering And Technology Academy At Esteban E. Torres High No. 3.
Ownership History
Date
Name
Owned For
Owner Type
Purchase Details
Closed on
Jul 13, 2021
Sold by
Gutierrez Jose Alberto
Bought by
Gutierrez Jose Alberto
Current Estimated Value
Purchase Details
Closed on
Jul 21, 2003
Sold by
Gutierrez Jeffrey Rene
Bought by
Gutierrez Jeffrey Rene and Gutierrez Jose Alberto
Home Financials for this Owner
Home Financials are based on the most recent Mortgage that was taken out on this home.
Original Mortgage
$125,000
Interest Rate
5.13%
Mortgage Type
Purchase Money Mortgage
Purchase Details
Closed on
Jul 16, 2003
Sold by
Gutierrez Jose Alberto and Gutierrez Jeffrey Rene
Bought by
Gutierrez Jeffrey Rene
Home Financials for this Owner
Home Financials are based on the most recent Mortgage that was taken out on this home.
Original Mortgage
$125,000
Interest Rate
5.13%
Mortgage Type
Purchase Money Mortgage
Create a Home Valuation Report for This Property
The Home Valuation Report is an in-depth analysis detailing your home's value as well as a comparison with similar homes in the area
Home Values in the Area
Average Home Value in this Area
Purchase History
| Date | Buyer | Sale Price | Title Company |
|---|---|---|---|
| Gutierrez Jose Alberto | -- | None Listed On Document | |
| Gutierrez Jeffrey Rene | -- | Diversified Title Services | |
| Gutierrez Jeffrey Rene | -- | Diversified Title & Escrow S |
Source: Public Records
Mortgage History
| Date | Status | Borrower | Loan Amount |
|---|---|---|---|
| Previous Owner | Gutierrez Jeffrey Rene | $125,000 |
Source: Public Records
Tax History Compared to Growth
Tax History
| Year | Tax Paid | Tax Assessment Tax Assessment Total Assessment is a certain percentage of the fair market value that is determined by local assessors to be the total taxable value of land and additions on the property. | Land | Improvement |
|---|---|---|---|---|
| 2025 | $4,600 | $291,742 | $194,503 | $97,239 |
| 2024 | $4,600 | $286,023 | $190,690 | $95,333 |
| 2023 | $4,359 | $280,415 | $186,951 | $93,464 |
| 2022 | $4,177 | $274,918 | $183,286 | $91,632 |
| 2021 | $4,127 | $269,529 | $179,693 | $89,836 |
| 2020 | $4,151 | $266,766 | $177,851 | $88,915 |
| 2019 | $4,013 | $261,536 | $174,364 | $87,172 |
| 2018 | $3,895 | $256,409 | $170,946 | $85,463 |
| 2016 | $3,734 | $246,455 | $164,309 | $82,146 |
| 2015 | $3,680 | $242,754 | $161,841 | $80,913 |
| 2014 | $3,684 | $238,000 | $158,671 | $79,329 |
Source: Public Records
Map
Nearby Homes
- 4126 E 1st St
- 120 N Bonnie Beach Place
- 116 N Bonnie Beach Place
- 4248 Michigan Ave
- 4233 Michigan Ave
- 4017 Michigan Ave
- 3878 E 1st St
- 4264 Capistrano Way
- 4268 Capistrano Way
- 3900 E 3rd St
- 3812 E 1st St
- 4316 Dozier St
- 445 S Bonnie Beach Place
- 3935 E Cesar e Chavez Ave
- 221 N Herbert Ave
- 126 N Eastman Ave
- 326 S Mcbride Ave
- 0 N Record Ave
- 531 S Sydney Dr
- 360 S Mcbride Ave
- 4131 Gleason St
- 4121 Gleason St
- 4135 Gleason St
- 4117 Gleason St
- 137 S Marianna Ave
- 133 S Marianna Ave
- 4115 Gleason St
- 4120 Zaring St
- 145 S Marianna Ave Unit 1
- 145 S Marianna Ave
- 153 S Marianna Ave
- 4114 Zaring St
- 4145 Gleason St Unit 1/2
- 4145 Gleason St
- 127 S Marianna Ave
- 4109 Glenason St
- 4109 Gleason St
- 4112 Zaring St
- 4106 Zaring St
- 4105 Gleason St