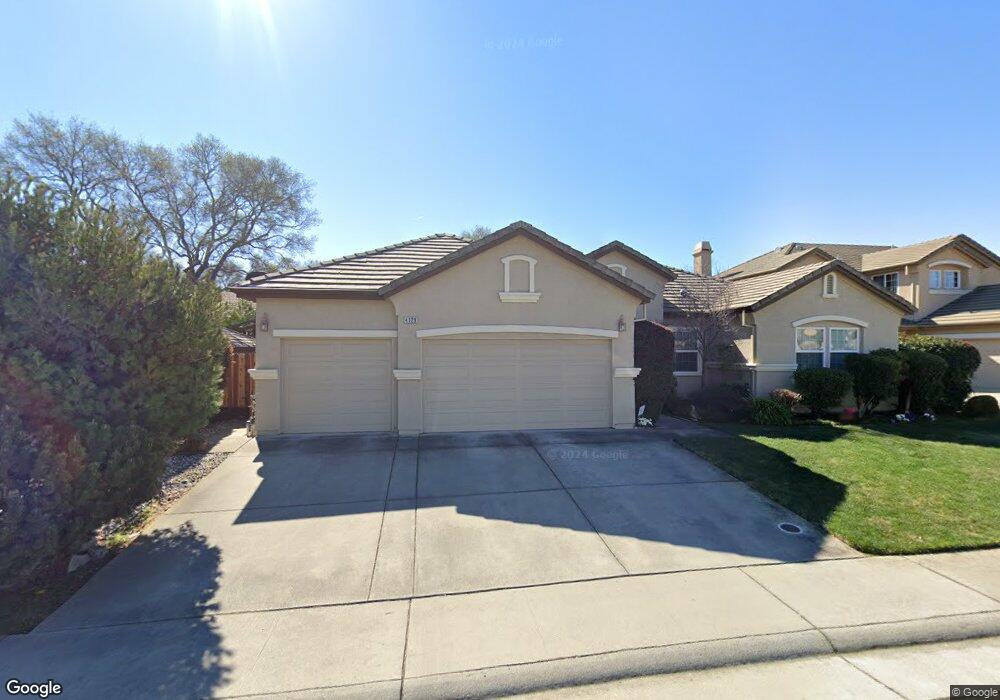
4129 Poppleton Way Carmichael, CA 95608
Estimated Value: $704,891 - $904,000
4
Beds
3
Baths
2,700
Sq Ft
$292/Sq Ft
Est. Value
About This Home
This home is located at 4129 Poppleton Way, Carmichael, CA 95608 and is currently estimated at $787,473, approximately $291 per square foot. 4129 Poppleton Way is a home located in Sacramento County with nearby schools including Albert Schweitzer Elementary School, John Barrett Middle School, and Del Campo High School.
Ownership History
Date
Name
Owned For
Owner Type
Purchase Details
Closed on
Oct 1, 2013
Sold by
Cates Robert D and Cates Monica C
Bought by
Caniglia Cates Robert D and Caniglia Cates Monica
Current Estimated Value
Purchase Details
Closed on
Jul 2, 2013
Sold by
Kim Gwang M and Kim Lynne M
Bought by
Cates Robert D and Cates Monica M
Home Financials for this Owner
Home Financials are based on the most recent Mortgage that was taken out on this home.
Original Mortgage
$200,000
Outstanding Balance
$144,627
Interest Rate
3.79%
Mortgage Type
New Conventional
Estimated Equity
$642,846
Purchase Details
Closed on
Nov 19, 2001
Sold by
Borge Development Inc
Bought by
Kim Gwang M and Kim Lynne M
Home Financials for this Owner
Home Financials are based on the most recent Mortgage that was taken out on this home.
Original Mortgage
$275,000
Interest Rate
6.57%
Create a Home Valuation Report for This Property
The Home Valuation Report is an in-depth analysis detailing your home's value as well as a comparison with similar homes in the area
Home Values in the Area
Average Home Value in this Area
Purchase History
| Date | Buyer | Sale Price | Title Company |
|---|---|---|---|
| Caniglia Cates Robert D | -- | None Available | |
| Cates Robert D | $450,000 | Fidelity National Title Co | |
| Kim Gwang M | $385,000 | Stewart Title |
Source: Public Records
Mortgage History
| Date | Status | Borrower | Loan Amount |
|---|---|---|---|
| Open | Cates Robert D | $200,000 | |
| Previous Owner | Kim Gwang M | $275,000 |
Source: Public Records
Tax History
| Year | Tax Paid | Tax Assessment Tax Assessment Total Assessment is a certain percentage of the fair market value that is determined by local assessors to be the total taxable value of land and additions on the property. | Land | Improvement |
|---|---|---|---|---|
| 2025 | $6,465 | $551,626 | $147,097 | $404,529 |
| 2024 | $6,465 | $540,811 | $144,213 | $396,598 |
| 2023 | $6,361 | $530,208 | $141,386 | $388,822 |
| 2022 | $6,233 | $519,813 | $138,614 | $381,199 |
| 2021 | $6,128 | $509,622 | $135,897 | $373,725 |
| 2020 | $6,013 | $504,397 | $134,504 | $369,893 |
| 2019 | $5,891 | $494,508 | $131,867 | $362,641 |
| 2018 | $5,821 | $484,813 | $129,282 | $355,531 |
| 2017 | $5,763 | $475,308 | $126,748 | $348,560 |
| 2016 | $5,382 | $465,989 | $124,263 | $341,726 |
| 2015 | $5,333 | $458,990 | $122,397 | $336,593 |
| 2014 | $5,222 | $450,000 | $120,000 | $330,000 |
Source: Public Records
Map
Nearby Homes
- 4072 Porton Ln
- 4076 Porton Ln
- 4085 Porton Ln
- 8213 Caminata Ln
- 4027 Porton Ln
- 4089 Porton Ln
- 4023 Porton Ln
- 4093 Porton Ln
- 4019 Porton Ln
- 4097 Porton Ln
- 4015 Porton Ln
- 4243 Glenridge Dr
- 4112 Alex Ln
- 4072 Alex Ln
- 6730 Lakeview Dr
- 4009 Fairwood Way
- 3745 Marshall Ave
- 4434 Mapel Ln
- 3900 Park Circle Ln Unit B
- 6420 Quiescence Ln Unit C
- 4133 Poppleton Way
- 4125 Poppleton Way
- 4030 Poppleton Way
- 4026 Poppleton Way
- 4034 Poppleton Way
- 4137 Poppleton Way
- 4128 Poppleton Way
- 4121 Poppleton Way
- 4124 Poppleton Way
- 4141 Poppleton Way
- 4022 Poppleton Way
- 4038 Poppleton Way
- 4120 Poppleton Way
- 4145 Poppleton Way
- 4117 Poppleton Way
- 6820 Lincoln Ave
- 4029 Poppleton Way
- 4033 Poppleton Way
- 4042 Poppleton Way
- 6826 Lincoln Ave
Your Personal Tour Guide
Ask me questions while you tour the home.