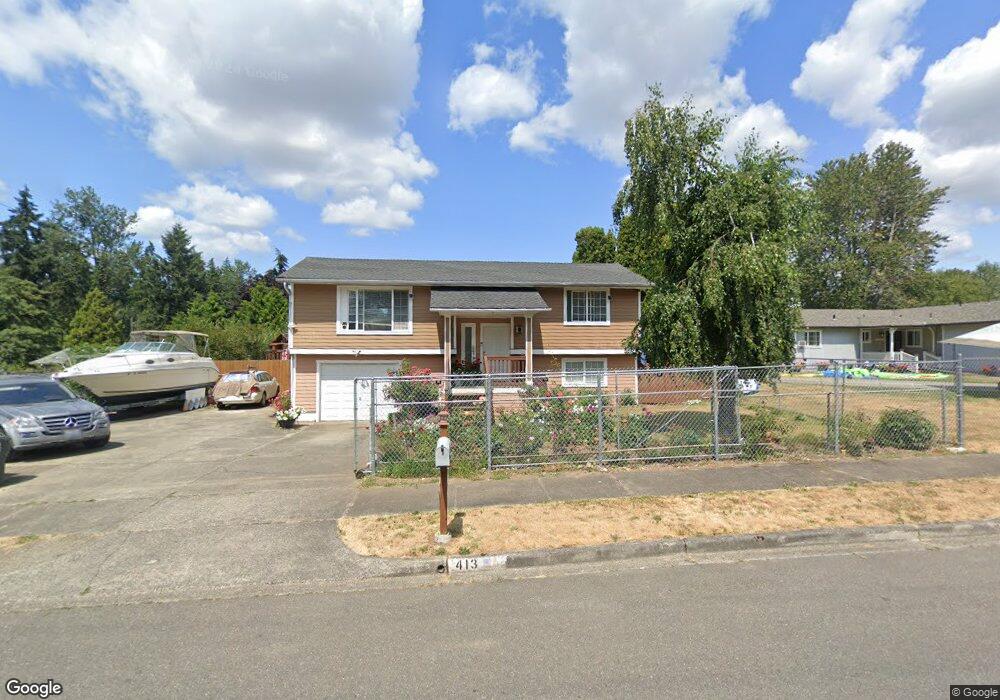
413 E 80th St Tacoma, WA 98404
South End NeighborhoodEstimated Value: $444,000 - $495,000
4
Beds
2
Baths
1,505
Sq Ft
$313/Sq Ft
Est. Value
About This Home
This home is located at 413 E 80th St, Tacoma, WA 98404 and is currently estimated at $471,670, approximately $313 per square foot. 413 E 80th St is a home located in Pierce County with nearby schools including Larchmont Elementary School, Baker Middle School, and Mount Tahoma High School.
Ownership History
Date
Name
Owned For
Owner Type
Purchase Details
Closed on
May 14, 2003
Sold by
Dejarlais Howard B
Bought by
Lutsyuk Andrey and Lutsyuk Mariya
Current Estimated Value
Home Financials for this Owner
Home Financials are based on the most recent Mortgage that was taken out on this home.
Original Mortgage
$111,920
Outstanding Balance
$48,359
Interest Rate
5.71%
Mortgage Type
Purchase Money Mortgage
Estimated Equity
$423,311
Purchase Details
Closed on
May 24, 2000
Sold by
Dejarlais Sherry L
Bought by
Dejarlais Ii Howard B
Home Financials for this Owner
Home Financials are based on the most recent Mortgage that was taken out on this home.
Original Mortgage
$45,000
Interest Rate
8.08%
Create a Home Valuation Report for This Property
The Home Valuation Report is an in-depth analysis detailing your home's value as well as a comparison with similar homes in the area
Home Values in the Area
Average Home Value in this Area
Purchase History
| Date | Buyer | Sale Price | Title Company |
|---|---|---|---|
| Lutsyuk Andrey | $139,900 | Chicago Title Insurance Co | |
| Dejarlais Ii Howard B | -- | Fidelity National Title |
Source: Public Records
Mortgage History
| Date | Status | Borrower | Loan Amount |
|---|---|---|---|
| Open | Lutsyuk Andrey | $111,920 | |
| Previous Owner | Dejarlais Ii Howard B | $45,000 |
Source: Public Records
Tax History
| Year | Tax Paid | Tax Assessment Tax Assessment Total Assessment is a certain percentage of the fair market value that is determined by local assessors to be the total taxable value of land and additions on the property. | Land | Improvement |
|---|---|---|---|---|
| 2025 | $4,491 | $457,200 | $206,500 | $250,700 |
| 2024 | $4,491 | $432,200 | $199,000 | $233,200 |
| 2023 | $4,491 | $403,300 | $189,500 | $213,800 |
| 2022 | $4,171 | $429,500 | $180,300 | $249,200 |
| 2021 | $3,825 | $304,200 | $114,800 | $189,400 |
| 2019 | $3,221 | $274,200 | $94,900 | $179,300 |
| 2018 | $3,218 | $247,700 | $76,900 | $170,800 |
| 2017 | $2,858 | $203,600 | $62,600 | $141,000 |
| 2016 | $2,491 | $154,100 | $46,800 | $107,300 |
| 2014 | $2,159 | $143,200 | $44,200 | $99,000 |
| 2013 | $2,159 | $125,200 | $38,900 | $86,300 |
Source: Public Records
Map
Nearby Homes
- 416 E 78th St
- 513 E 78th St
- 521 E 78th St
- 7552 E F St
- 7918 Mckinley Ave
- 610 E 75th St
- 8212 8th Avenue Ct E Unit 1
- 7459 A St
- 1013 1015 76th Street Ct E Unit 1-8
- 7225 E G St
- 7802 Golden Given Rd E
- 7603 Pacific Ave
- 7656 Pacific Ave
- 7601 S C St
- 301 S 82nd St
- 302 S 76th St
- 6965 E E St
- 7212 S Bell St
- 319 S 82nd St
- 8515 Golden Given Rd E
Your Personal Tour Guide
Ask me questions while you tour the home.