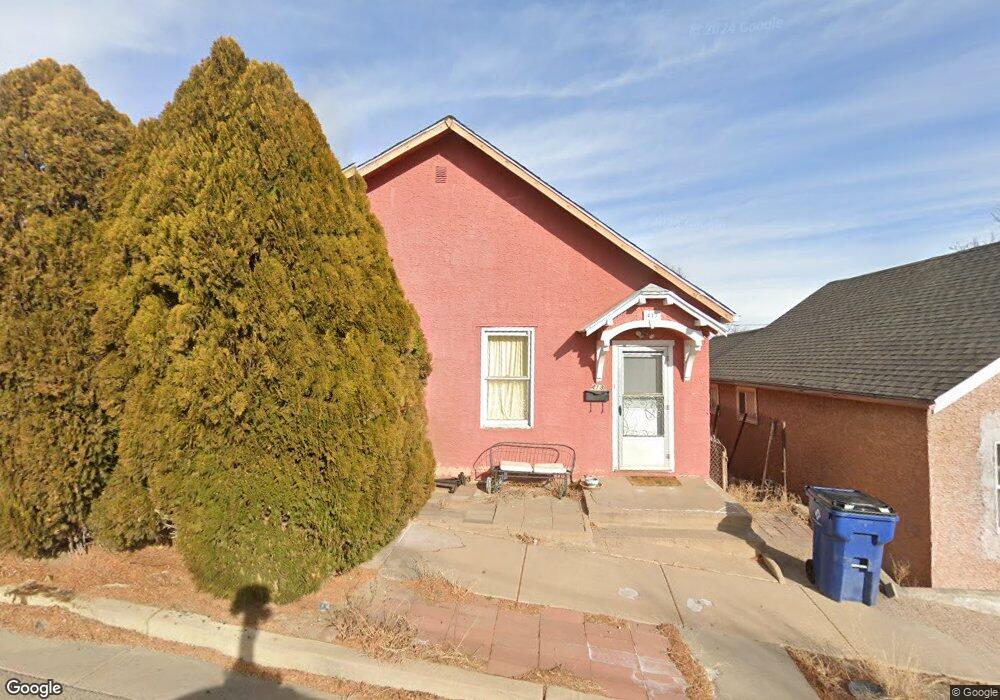
413 E Beech St Pueblo, CO 81003
Downtown NeighborhoodEstimated Value: $150,000 - $177,000
2
Beds
1
Bath
1,028
Sq Ft
$157/Sq Ft
Est. Value
About This Home
This home is located at 413 E Beech St, Pueblo, CO 81003 and is currently estimated at $161,000, approximately $156 per square foot. 413 E Beech St is a home located in Pueblo County with nearby schools including Bradford Elementary School, Risley International Academy of Innovation, and Centennial High School.
Ownership History
Date
Name
Owned For
Owner Type
Purchase Details
Closed on
Dec 22, 2017
Sold by
Trujillo Jose M
Bought by
Pueblo Rental Propertiess Llc
Current Estimated Value
Purchase Details
Closed on
Feb 7, 2006
Sold by
Trujillo Jennie M
Bought by
Trujillo Jennie M and Trujillo Jose M
Purchase Details
Closed on
Oct 6, 1989
Sold by
Perrotta Carmella
Bought by
Trujillo Joe D + Jennie M
Purchase Details
Closed on
Sep 12, 1985
Bought by
Perrotta Carmella
Purchase Details
Closed on
Jul 30, 1985
Bought by
Perrotta +Carmella
Create a Home Valuation Report for This Property
The Home Valuation Report is an in-depth analysis detailing your home's value as well as a comparison with similar homes in the area
Home Values in the Area
Average Home Value in this Area
Purchase History
| Date | Buyer | Sale Price | Title Company |
|---|---|---|---|
| Pueblo Rental Propertiess Llc | $45,000 | Capstone Title | |
| Trujillo Jennie M | -- | None Available | |
| Trujillo Joe D + Jennie M | $13,000 | -- | |
| Perrotta Carmella | -- | -- | |
| Perrotta +Carmella | -- | -- |
Source: Public Records
Tax History
| Year | Tax Paid | Tax Assessment Tax Assessment Total Assessment is a certain percentage of the fair market value that is determined by local assessors to be the total taxable value of land and additions on the property. | Land | Improvement |
|---|---|---|---|---|
| 2024 | $694 | $7,040 | -- | -- |
| 2023 | $703 | $10,730 | $1,010 | $9,720 |
| 2022 | $701 | $7,060 | $430 | $6,630 |
| 2021 | $723 | $7,260 | $440 | $6,820 |
| 2020 | $521 | $7,260 | $440 | $6,820 |
| 2019 | $521 | $5,160 | $189 | $4,971 |
| 2018 | $300 | $3,306 | $191 | $3,115 |
| 2017 | $303 | $3,306 | $191 | $3,115 |
| 2016 | $284 | $3,123 | $211 | $2,912 |
| 2015 | $72 | $3,123 | $211 | $2,912 |
| 2014 | $83 | $3,611 | $211 | $3,400 |
Source: Public Records
Map
Nearby Homes
- 615 E 1st St
- 225 N Bradford Ave
- 903 Catalpa St
- 711 E 3rd St
- 904 E 1st St
- 806 E 3rd St
- 915 E River St
- 211 W 2nd St
- 102 S Union Ave Unit 205
- 829 E 3rd St
- 224 W 3rd St
- 1001 E 2nd St
- 224 - 228 W 3rd St Unit 7
- 207 Spring St
- 812 E 6th St
- 1015 E 3rd St
- 221 E 4th St Unit 223
- 228 Plum St
- TBD E Beech St
- 912 E 6th St
Your Personal Tour Guide
Ask me questions while you tour the home.