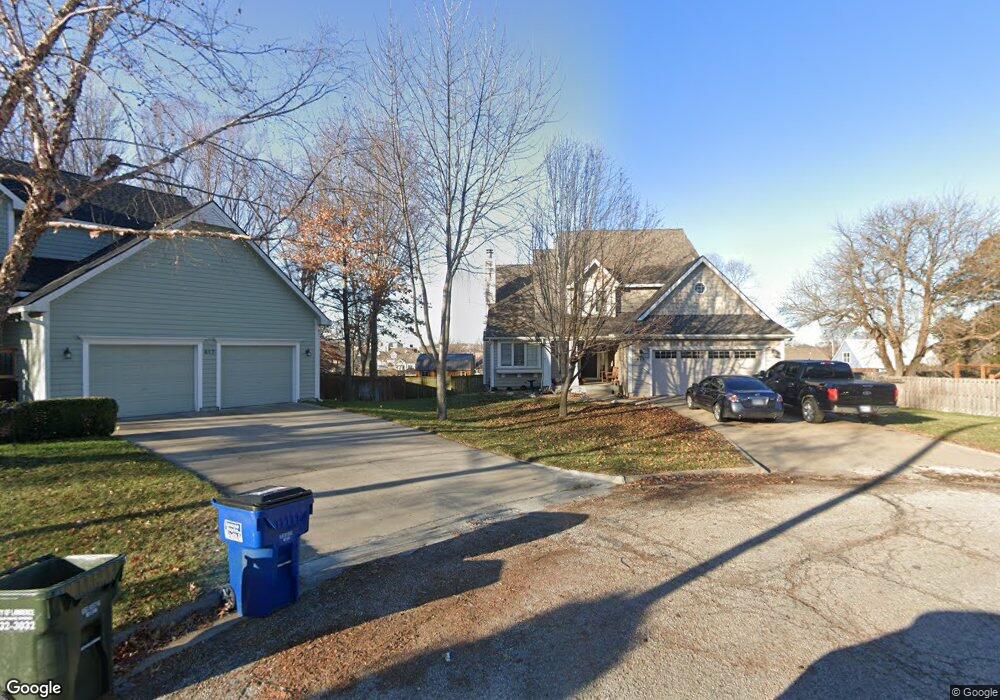
413 Nancy Ct Lawrence, KS 66049
Estimated Value: $416,681 - $439,000
5
Beds
4
Baths
2,717
Sq Ft
$157/Sq Ft
Est. Value
About This Home
This home is located at 413 Nancy Ct, Lawrence, KS 66049 and is currently estimated at $426,170, approximately $156 per square foot. 413 Nancy Ct is a home located in Douglas County with nearby schools including Quail Run Elementary School, West Middle School, and Lawrence Free State High School.
Ownership History
Date
Name
Owned For
Owner Type
Purchase Details
Closed on
Mar 20, 2024
Sold by
Maninger John
Bought by
Maninger John and Hildreth Jessica
Current Estimated Value
Purchase Details
Closed on
Sep 28, 2022
Sold by
Hockenbury Tamantha S
Bought by
Maninger John
Home Financials for this Owner
Home Financials are based on the most recent Mortgage that was taken out on this home.
Original Mortgage
$270,580
Interest Rate
5.13%
Mortgage Type
New Conventional
Purchase Details
Closed on
Aug 11, 2020
Sold by
Hockenbury Todd E
Bought by
Hockenbury Tamantha S
Home Financials for this Owner
Home Financials are based on the most recent Mortgage that was taken out on this home.
Original Mortgage
$210,000
Interest Rate
3%
Mortgage Type
New Conventional
Create a Home Valuation Report for This Property
The Home Valuation Report is an in-depth analysis detailing your home's value as well as a comparison with similar homes in the area
Purchase History
We collect this data history from publicly available records. To have your information removed, we recommend requesting removal directly through your county’s website.
| Date | Buyer | Sale Price | Title Company |
|---|---|---|---|
| Maninger John | -- | None Listed On Document | |
| Maninger John | -- | Meridian Title | |
| Hockenbury Tamantha S | -- | Continental Title Company |
Source: Public Records
Mortgage History
We collect this data history from publicly available records. To have your information removed, we recommend requesting removal directly through your county’s website.
| Date | Status | Borrower | Loan Amount |
|---|---|---|---|
| Previous Owner | Maninger John | $270,580 | |
| Previous Owner | Hockenbury Tamantha S | $210,000 |
Source: Public Records
Tax History
| Year | Tax Paid | Tax Assessment Tax Assessment Total Assessment is a certain percentage of the fair market value that is determined by local assessors to be the total taxable value of land and additions on the property. | Land | Improvement |
|---|---|---|---|---|
| 2025 | $5,459 | $43,919 | $7,475 | $36,444 |
| 2024 | $5,067 | $40,838 | $7,475 | $33,363 |
| 2023 | $5,003 | $38,893 | $6,900 | $31,993 |
| 2022 | $5,225 | $40,285 | $6,900 | $33,385 |
| 2021 | $4,525 | $33,845 | $5,980 | $27,865 |
| 2020 | $4,367 | $32,844 | $5,980 | $26,864 |
| 2019 | $4,139 | $31,177 | $5,060 | $26,117 |
| 2018 | $3,968 | $29,682 | $4,600 | $25,082 |
| 2017 | $3,955 | $29,256 | $4,600 | $24,656 |
| 2016 | $3,733 | $28,854 | $3,450 | $25,404 |
| 2015 | $3,664 | $28,325 | $3,450 | $24,875 |
Source: Public Records
Map
Nearby Homes
- 413 Terri Ct
- 401 Casa Bonita Dr
- 4217 Briarwood Dr
- 416 Eldridge St
- 433 Seele Dr
- 4125 Seele Way
- 4116 Doolittle Dr
- 4015 Overland Dr
- 4013 Overland Dr
- 3929 Stetson Dr
- 133 Tumbleweed Dr
- 4304 Crofton Terrace
- 120 Tumbleweed Dr
- 4508 Lili Dr
- 4624 Hearthside Dr
- 721 Eldridge St
- 142 Aspen Ln
- 3811 Overland Dr
- 3817 Stetson Dr
- 213 Stockade St
- 409 Nancy Ct
- 417 Nancy Ct
- 405 Nancy Ct
- 4408 Roundabout Cir
- 4404 Roundabout Cir
- 401 Pasadena Dr
- 416 Nancy Ct
- 412 Nancy Ct
- 408 Nancy Ct
- 4412 Roundabout Cir
- 401 Nancy Ct
- 404 Nancy Ct
- 4228 Catalina Dr
- 4416 Roundabout Cir
- 4400 Roundabout Cir
- 4224 Catalina Dr
- 400 Nancy Ct
- 4420 Roundabout Cir
- 409 Terri Ct
- 4404 Freedom Creek Dr
Your Personal Tour Guide
Ask me questions while you tour the home.