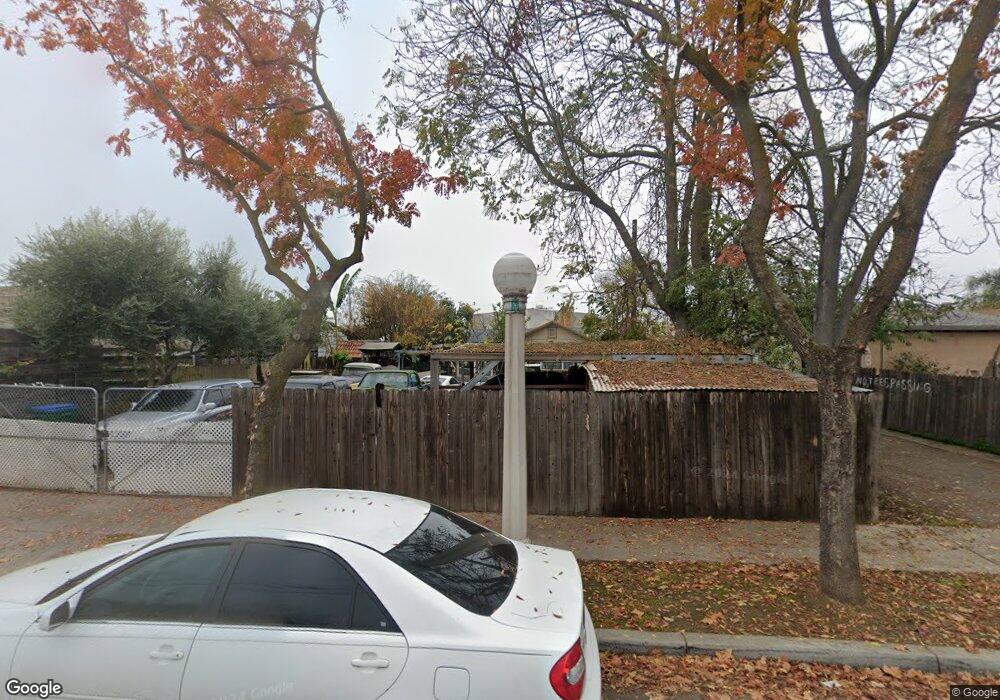
413 S Stockton St Lodi, CA 95240
Downtown Lodi NeighborhoodEstimated Value: $72,000 - $309,000
3
Beds
1
Bath
928
Sq Ft
$242/Sq Ft
Est. Value
About This Home
This home is located at 413 S Stockton St, Lodi, CA 95240 and is currently estimated at $224,833, approximately $242 per square foot. 413 S Stockton St is a home located in San Joaquin County with nearby schools including Clyde W. Needham Elementary School, Lodi Middle School, and Tokay High School.
Ownership History
Date
Name
Owned For
Owner Type
Purchase Details
Closed on
Nov 13, 2015
Sold by
Carrillo Jennifer
Bought by
Martinez Araceli Perez
Current Estimated Value
Purchase Details
Closed on
Feb 13, 2013
Sold by
Carrillo Abel
Bought by
Carrillo Jennifer
Purchase Details
Closed on
Sep 18, 2008
Sold by
Newfield Joseph and Newfield Sheila
Bought by
Carrillo Able
Purchase Details
Closed on
Sep 5, 2008
Sold by
Din Shoukat
Bought by
Newfield Joe
Purchase Details
Closed on
Oct 13, 1999
Sold by
Din Aisha
Bought by
Din Shoukat
Home Financials for this Owner
Home Financials are based on the most recent Mortgage that was taken out on this home.
Original Mortgage
$38,000
Interest Rate
7.82%
Mortgage Type
Seller Take Back
Create a Home Valuation Report for This Property
The Home Valuation Report is an in-depth analysis detailing your home's value as well as a comparison with similar homes in the area
Home Values in the Area
Average Home Value in this Area
Purchase History
| Date | Buyer | Sale Price | Title Company |
|---|---|---|---|
| Martinez Araceli Perez | -- | None Available | |
| Carrillo Jennifer | -- | None Available | |
| Carrillo Able | $40,500 | Chicago Title Company | |
| Newfield Joe | $53,910 | None Available | |
| Din Shoukat | -- | Chicago Title Co | |
| Din Shoukat | $45,000 | Chicago Title Co |
Source: Public Records
Mortgage History
| Date | Status | Borrower | Loan Amount |
|---|---|---|---|
| Previous Owner | Din Shoukat | $38,000 |
Source: Public Records
Tax History Compared to Growth
Tax History
| Year | Tax Paid | Tax Assessment Tax Assessment Total Assessment is a certain percentage of the fair market value that is determined by local assessors to be the total taxable value of land and additions on the property. | Land | Improvement |
|---|---|---|---|---|
| 2025 | $582 | $51,504 | $20,601 | $30,903 |
| 2024 | $566 | $50,496 | $20,198 | $30,298 |
| 2023 | $552 | $49,506 | $19,802 | $29,704 |
| 2022 | $539 | $48,536 | $19,414 | $29,122 |
| 2021 | $549 | $47,585 | $19,034 | $28,551 |
| 2020 | $535 | $47,098 | $18,839 | $28,259 |
| 2019 | $525 | $46,175 | $18,470 | $27,705 |
| 2018 | $517 | $45,270 | $18,108 | $27,162 |
| 2017 | $506 | $44,383 | $17,753 | $26,630 |
| 2016 | $475 | $43,513 | $17,405 | $26,108 |
| 2015 | $470 | $42,859 | $17,143 | $25,716 |
| 2014 | $465 | $42,021 | $16,808 | $25,213 |
Source: Public Records
Map
Nearby Homes
- 326 Eden St Unit 1/2
- 329 E Walnut St
- 530 S School St
- 317 Church St
- 335 E Oak St
- 716 S Central Ave
- 436 E Walnut St
- 513 Harold St
- 613 S Lee Ave
- 709 S Lee Ave
- 18 W Vine St
- 121 N Central Ave
- 421 E Elm St
- 542 Sturla St
- 503 Saint Claire Dr
- 337 Concord St
- 101 W Lockeford St
- 113 N Cherokee Ln
- 431 W Elm St
- 625 E Pine St
- 407 S Stockton St
- 401 S Stockton St
- 323 S Stockton St
- 412 S Stockton St
- 200 Hilborn St
- 317 S Stockton St
- 422 S Stockton St
- 204 Hilborn St
- 204 Hilborn St
- 205 Flora St
- 315 S Stockton St
- 208 Hilborn St
- 201 Hilborn St
- 209 Flora St
- 205 Hilborn St
- 212 Hilborn St
- 501 S Stockton St
- 108 Flora St
- 213 Flora St
- 112 Flora St