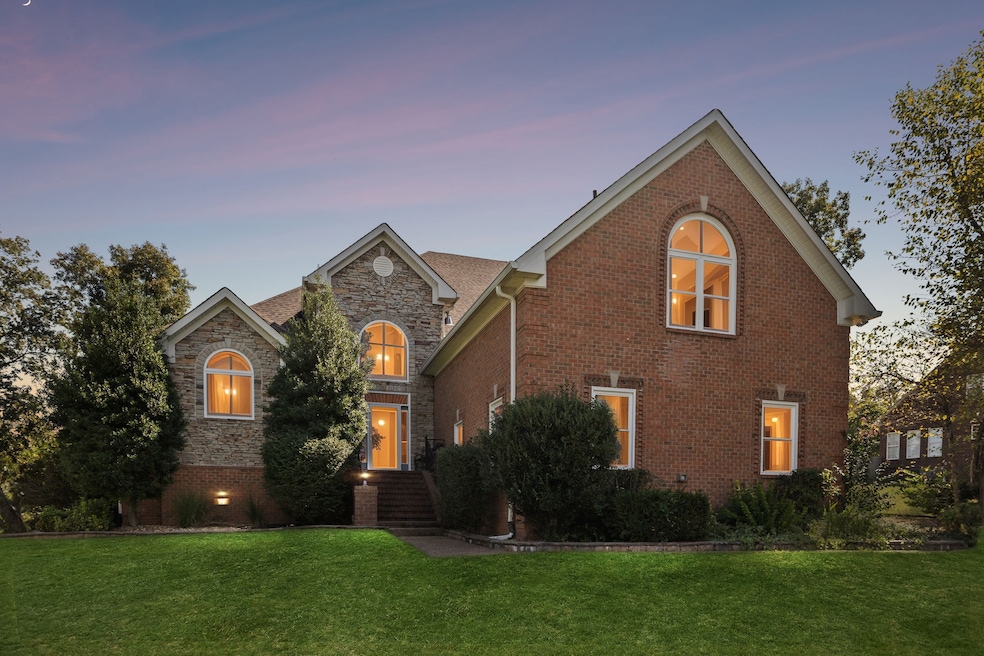
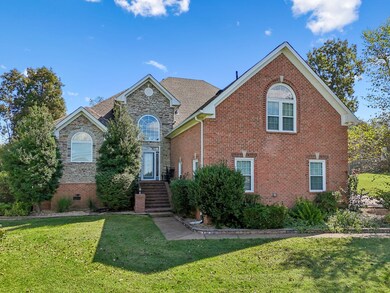
413 Stockbridge Way Mount Juliet, TN 37122
Estimated payment $5,326/month
Highlights
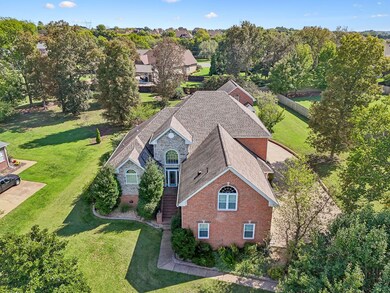
- 0.57 Acre Lot
- Clubhouse
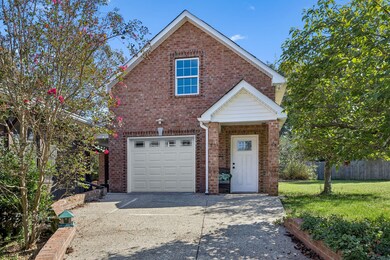
- Traditional Architecture
- Rutland Elementary School Rated A
- Deck
- Wood Flooring
About This Home
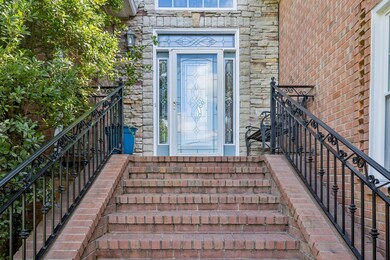
Welcome to this large stunning all-brick home located in the desirable Wright Farms subdivision in Mount Juliet, just 13 miles from BNA airport. Offering 4 bedrooms and 3.5 bathrooms. Step inside to find beautiful oak hardwood floors throughout the main living spaces, paired with ceramic tile in the bathrooms and laundry room. The kitchen is highlighted by granite countertops, stainless steel appliances, and plenty of space for cooking and entertaining. Builder-grade windows have been replaced with Energy Star insulated windows throughout and the HVAC unit was replaced with Dual source high efficiency units, bringing improved efficiency and comfort to the home. The main-level primary suite is a true retreat, featuring a custom-built walk-in closet with LED lighting and a spa-like ensuite with a walk-in tiled shower and a separate soaking tub designed for relaxation. Upon ascending the stairs to the second story, you are greeted by a custom built office. Secondary bedrooms are spacious with generous walk-in closets, while a large bonus room above the garage includes custom-built shelving with LED track lighting, creating the perfect space for recreation, hobbies, or a media room.
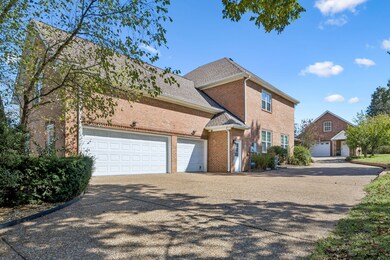
The property also offers incredible garage space. In addition to the attached 3-car garage—one bay of which is heated and cooled—there is a heated and cooled detached single-car garage with two stories, ideal for storage, a workshop, or creative projects. This detached garage is equipped with heavy duty electrical outlets for heavy machinery and even includes its own elevator, offering both function and convenience.
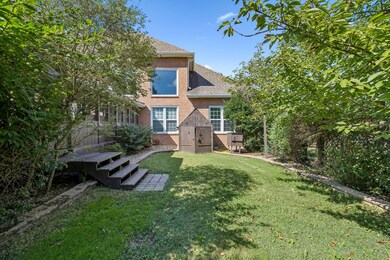
Outdoor living is equally impressive, with a screened breezeway that connects to a covered screened porch, creating the perfect spot to enjoy fresh air year-round. A lean-to and beautiful custom built stone fire pit add to the backyard appeal, offering multiple spaces for gatherings and entertaining. Residents of Wright Farms also enjoy access to a community pool and club house.
Listing Agent
Benchmark Realty, LLC Brokerage Phone: 6154734582 License #366004 Listed on: 11/19/2025

Home Details
Home Type
- Single Family
Est. Annual Taxes
- $3,143
Year Built
- Built in 2006
HOA Fees
- $63 Monthly HOA Fees
Parking
- 4 Car Garage
- 6 Open Parking Spaces
- Garage Door Opener
Home Design
- Traditional Architecture
- Brick Exterior Construction
- Shingle Roof
Interior Spaces
- 3,522 Sq Ft Home
- Property has 2 Levels
- Built-In Features
- Bookcases
- High Ceiling
- Ceiling Fan
- Gas Fireplace
- ENERGY STAR Qualified Windows
- Entrance Foyer
- Living Room with Fireplace
- Screened Porch
- Crawl Space
Kitchen
- Built-In Electric Oven
- Cooktop
- Microwave
- Ice Maker
- Dishwasher
- Stainless Steel Appliances
- Smart Appliances
- ENERGY STAR Qualified Appliances
- Kitchen Island
- Disposal
Flooring
- Wood
- Tile
Bedrooms and Bathrooms
- 4 Bedrooms | 1 Main Level Bedroom
- Walk-In Closet
- Soaking Tub
Laundry
- Laundry Room
- Dryer
Home Security
- Home Security System
- Smart Lights or Controls
- Fire and Smoke Detector
Outdoor Features
- Deck
- Patio
Schools
- Rutland Elementary School
- Gladeville Middle School
- Wilson Central High School
Utilities
- Central Heating and Cooling System
- Two Heating Systems
- Heating System Uses Natural Gas
- High-Efficiency Water Heater
- STEP System includes septic tank and pump
- High Speed Internet
- Cable TV Available
Additional Features
- Accessible Elevator Installed
- ENERGY STAR Qualified Equipment for Heating
- 0.57 Acre Lot
Listing and Financial Details
- Assessor Parcel Number 099C B 03500 000
Community Details
Overview
- Association fees include recreation facilities
- Wright Farms Subdivision
Amenities
- Clubhouse
Recreation
- Community Pool
Map
Home Values in the Area
Average Home Value in this Area
Tax History
| Year | Tax Paid | Tax Assessment Tax Assessment Total Assessment is a certain percentage of the fair market value that is determined by local assessors to be the total taxable value of land and additions on the property. | Land | Improvement |
|---|---|---|---|---|
| 2024 | $3,143 | $164,650 | $25,000 | $139,650 |
| 2022 | $3,143 | $164,650 | $25,000 | $139,650 |
| 2021 | $3,143 | $164,650 | $25,000 | $139,650 |
| 2020 | $3,130 | $164,650 | $25,000 | $139,650 |
| 2019 | $3,122 | $123,925 | $22,500 | $101,425 |
| 2018 | $3,122 | $123,925 | $22,500 | $101,425 |
| 2017 | $3,122 | $123,925 | $22,500 | $101,425 |
| 2016 | $2,972 | $117,975 | $22,500 | $95,475 |
| 2015 | $3,032 | $117,975 | $22,500 | $95,475 |
| 2014 | $2,448 | $95,235 | $0 | $0 |
Property History
| Date | Event | Price | List to Sale | Price per Sq Ft |
|---|---|---|---|---|
| 11/22/2025 11/22/25 | For Sale | $949,900 | -- | $270 / Sq Ft |
Purchase History
| Date | Type | Sale Price | Title Company |
|---|---|---|---|
| Deed | $358,000 | -- | |
| Deed | $304,165 | -- | |
| Deed | $319,900 | -- | |
| Warranty Deed | $1,919,800 | -- |
Mortgage History
| Date | Status | Loan Amount | Loan Type |
|---|---|---|---|
| Closed | $225,000 | No Value Available |
Source: Realtracs
MLS Number: 3048152
APN: 099C-B-035.00
Disclaimer: Certain information contained herein is derived from information provided by parties other than Homes.com. All information provided is deemed reliable, but is not guaranteed to be accurate and should be independently verified.
![]() Based on information submitted to the MLS GRID. All data is obtained from various sources and may not have been verified by broker or MLS GRID. Supplied Open House Information is subject to change without notice. All information should be independently reviewed and verified for accuracy. Properties may or may not be listed by the office/agent presenting the information. Some IDX listings have been excluded from this website.
Based on information submitted to the MLS GRID. All data is obtained from various sources and may not have been verified by broker or MLS GRID. Supplied Open House Information is subject to change without notice. All information should be independently reviewed and verified for accuracy. Properties may or may not be listed by the office/agent presenting the information. Some IDX listings have been excluded from this website.
The Digital Millennium Copyright Act of 1998, 17 U.S.C. § 512 (the “DMCA”) provides recourse for copyright owners who believe that material appearing on the Internet infringes their rights under U.S. copyright law. If you believe in good faith that any content or material made available in connection with our website or services infringes your copyright, you (or your agent) may send us a notice requesting that the content or material be removed, or access to it blocked.
Notices must be sent in writing by email to DMCAnotice@MLSGrid.com.
The DMCA requires that your notice of alleged copyright infringement include the following information:
(1) description of the copyrighted work that is the subject of claimed infringement;
(2) description of the alleged infringing content and information sufficient to permit us to locate the content;
(3) contact information for you, including your address, telephone number and email address;
(4) a statement by you that you have a good faith belief that the content in the manner complained of is not authorized by the copyright owner, or its agent, or by the operation of any law;
(5) a statement by you, signed under penalty of perjury, that the information in the notification is accurate and that you have the authority to enforce the copyrights that are claimed to be infringed; and
(6) a physical or electronic signature of the copyright owner or a person authorized to act on the copyright owner’s behalf. Failure to include all of the above information may result in the delay of the processing of your complaint.
- 805 Harrisburg Ln
- 15 Beechwood Ct
- 1322 Rothmon Blvd
- 1118 Garrett Way
- 862 Harrisburg Ln
- 842 Harrisburg Ln
- 223 Rosemary Way
- 580 Windy Rd
- 228 Rosemary Way
- 312 Union Pier Dr Unit 312
- 1013 Station Cir
- 321 Union Pier Dr
- 770 S Rutland Rd
- 323 Alexis St
- 503 Weymouth Ln
- 507 Pine Valley Rd
- 3169 Aidan Ln
- 601 Maple Brook Ln
- 213 Caroline Way
- 521 Pine Valley Rd
- 110 Wynfield Blvd
- 312 Union Pier Dr
- 1168 Carlisle Place
- 1313 Kettlehook Ln
- 216 Caroline Way
- 544 Windy Rd
- 2129 Erin Ln
- 3141 Aidan Ln
- 2137 Erin Ln
- 2118 Erin Ln
- 2151 Erin Ln
- 2187 Erin Ln
- 207 S Dunnwood Ln
- 420 Laurel Hills Dr
- 2000 Buckhead Trail
- 302 Forest Bend Dr
- 319 Forest Bend Dr
- 1125 Westwood
- 708 Viceroy Trail
- 20 Friary Ct