Estimated Value: $765,755 - $841,000
4
Beds
2
Baths
1,750
Sq Ft
$452/Sq Ft
Est. Value
About This Home
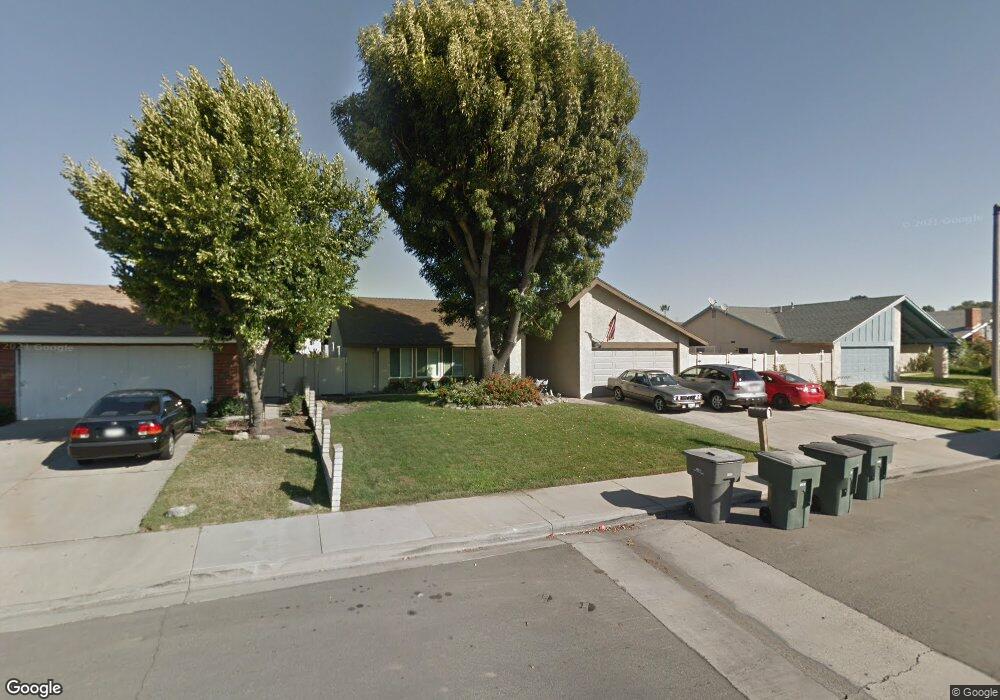
This home is located at 4130 Van Buren St, Chino, CA 91710 and is currently estimated at $791,689, approximately $452 per square foot. 4130 Van Buren St is a home located in San Bernardino County with nearby schools including Newman Elementary, Ramona Junior High School, and Don Antonio Lugo High School.
Ownership History
Date
Name
Owned For
Owner Type
Purchase Details
Closed on
Jun 8, 2004
Sold by
Vance Milton N
Bought by
Castro Jose and Castro Imelda
Current Estimated Value
Home Financials for this Owner
Home Financials are based on the most recent Mortgage that was taken out on this home.
Original Mortgage
$306,400
Outstanding Balance
$150,683
Interest Rate
6.09%
Mortgage Type
Stand Alone First
Estimated Equity
$641,006
Create a Home Valuation Report for This Property
The Home Valuation Report is an in-depth analysis detailing your home's value as well as a comparison with similar homes in the area
Home Values in the Area
Average Home Value in this Area
Purchase History
| Date | Buyer | Sale Price | Title Company |
|---|---|---|---|
| Castro Jose | $402,000 | Chicago Title Company |
Source: Public Records
Mortgage History
| Date | Status | Borrower | Loan Amount |
|---|---|---|---|
| Open | Castro Jose | $306,400 |
Source: Public Records
Tax History
| Year | Tax Paid | Tax Assessment Tax Assessment Total Assessment is a certain percentage of the fair market value that is determined by local assessors to be the total taxable value of land and additions on the property. | Land | Improvement |
|---|---|---|---|---|
| 2025 | $6,293 | $571,564 | $200,048 | $371,516 |
| 2024 | $6,123 | $560,356 | $196,125 | $364,231 |
| 2023 | $5,952 | $549,368 | $192,279 | $357,089 |
| 2022 | $5,916 | $538,596 | $188,509 | $350,087 |
| 2021 | $5,799 | $528,036 | $184,813 | $343,223 |
| 2020 | $5,723 | $522,622 | $182,918 | $339,704 |
| 2019 | $5,330 | $486,008 | $170,710 | $315,298 |
| 2018 | $5,316 | $486,008 | $170,710 | $315,298 |
| 2017 | $4,950 | $452,100 | $158,800 | $293,300 |
| 2016 | $4,490 | $430,500 | $151,200 | $279,300 |
| 2015 | $4,325 | $410,000 | $144,000 | $266,000 |
| 2014 | $4,135 | $392,000 | $137,000 | $255,000 |
Source: Public Records
Map
Nearby Homes
- 4152 Kennedy Ct
- 12608 Ramona Ave
- 4258 Wintress Dr
- 3709 Kern Rd
- 12620 Anthony Place
- 13144 Pipeline Ave
- 12629 Thomas Place
- 3927 Christina Rd
- 13140 Derby Ave
- 13148 Derby Ave
- 4400 Philadelphia St Unit 71
- 12818 Mckinley Ave
- 4610 Philadelphia St
- 4836 Terry Ave
- 12488 Monte Vista Ave
- 13065 San Clemente Ln
- 4115 Bernardo Ct
- 4621 Chino Ave
- 11814 Ramona Ave
- 5039 Tyler St
- 4142 Van Buren St
- 4118 Van Buren St
- 4125 Polk Ct
- 4113 Polk Ct
- 4137 Polk Ct
- 4144 Van Buren St
- 4106 Van Buren St
- 4131 Van Buren St
- 4159 Polk Ct
- 4101 Polk Ct
- 4143 Van Buren St
- 12636 Witherspoon Rd
- 4156 Van Buren St
- 4145 Van Buren St
- 4161 Polk Ct
- 12640 Witherspoon Rd
- 12653 Witherspoon Rd
- 4157 Van Buren St
- 4128 Polk Ct
- 4136 Polk Ct
Your Personal Tour Guide
Ask me questions while you tour the home.